This case study is an example of clean LaTeX typesetting for a scientific text with formulas, tables, illustrations, and reproducible source files. The project prepares an English version of R. A. Fisher's paper “The use of Multiple Measurements in Taxonomic Problems” using the iris data set: from the source TeX file to a compiled PDF.
GitHub project: raskumandrin/fisher
Raw LaTeX source: fisher.tex
This type of work is useful when a scientific, educational, or methodological text needs more than simple text entry. Formulas must compile correctly, tables must stay stable, images must be connected to the document, and the final PDF must read as a coherent article.
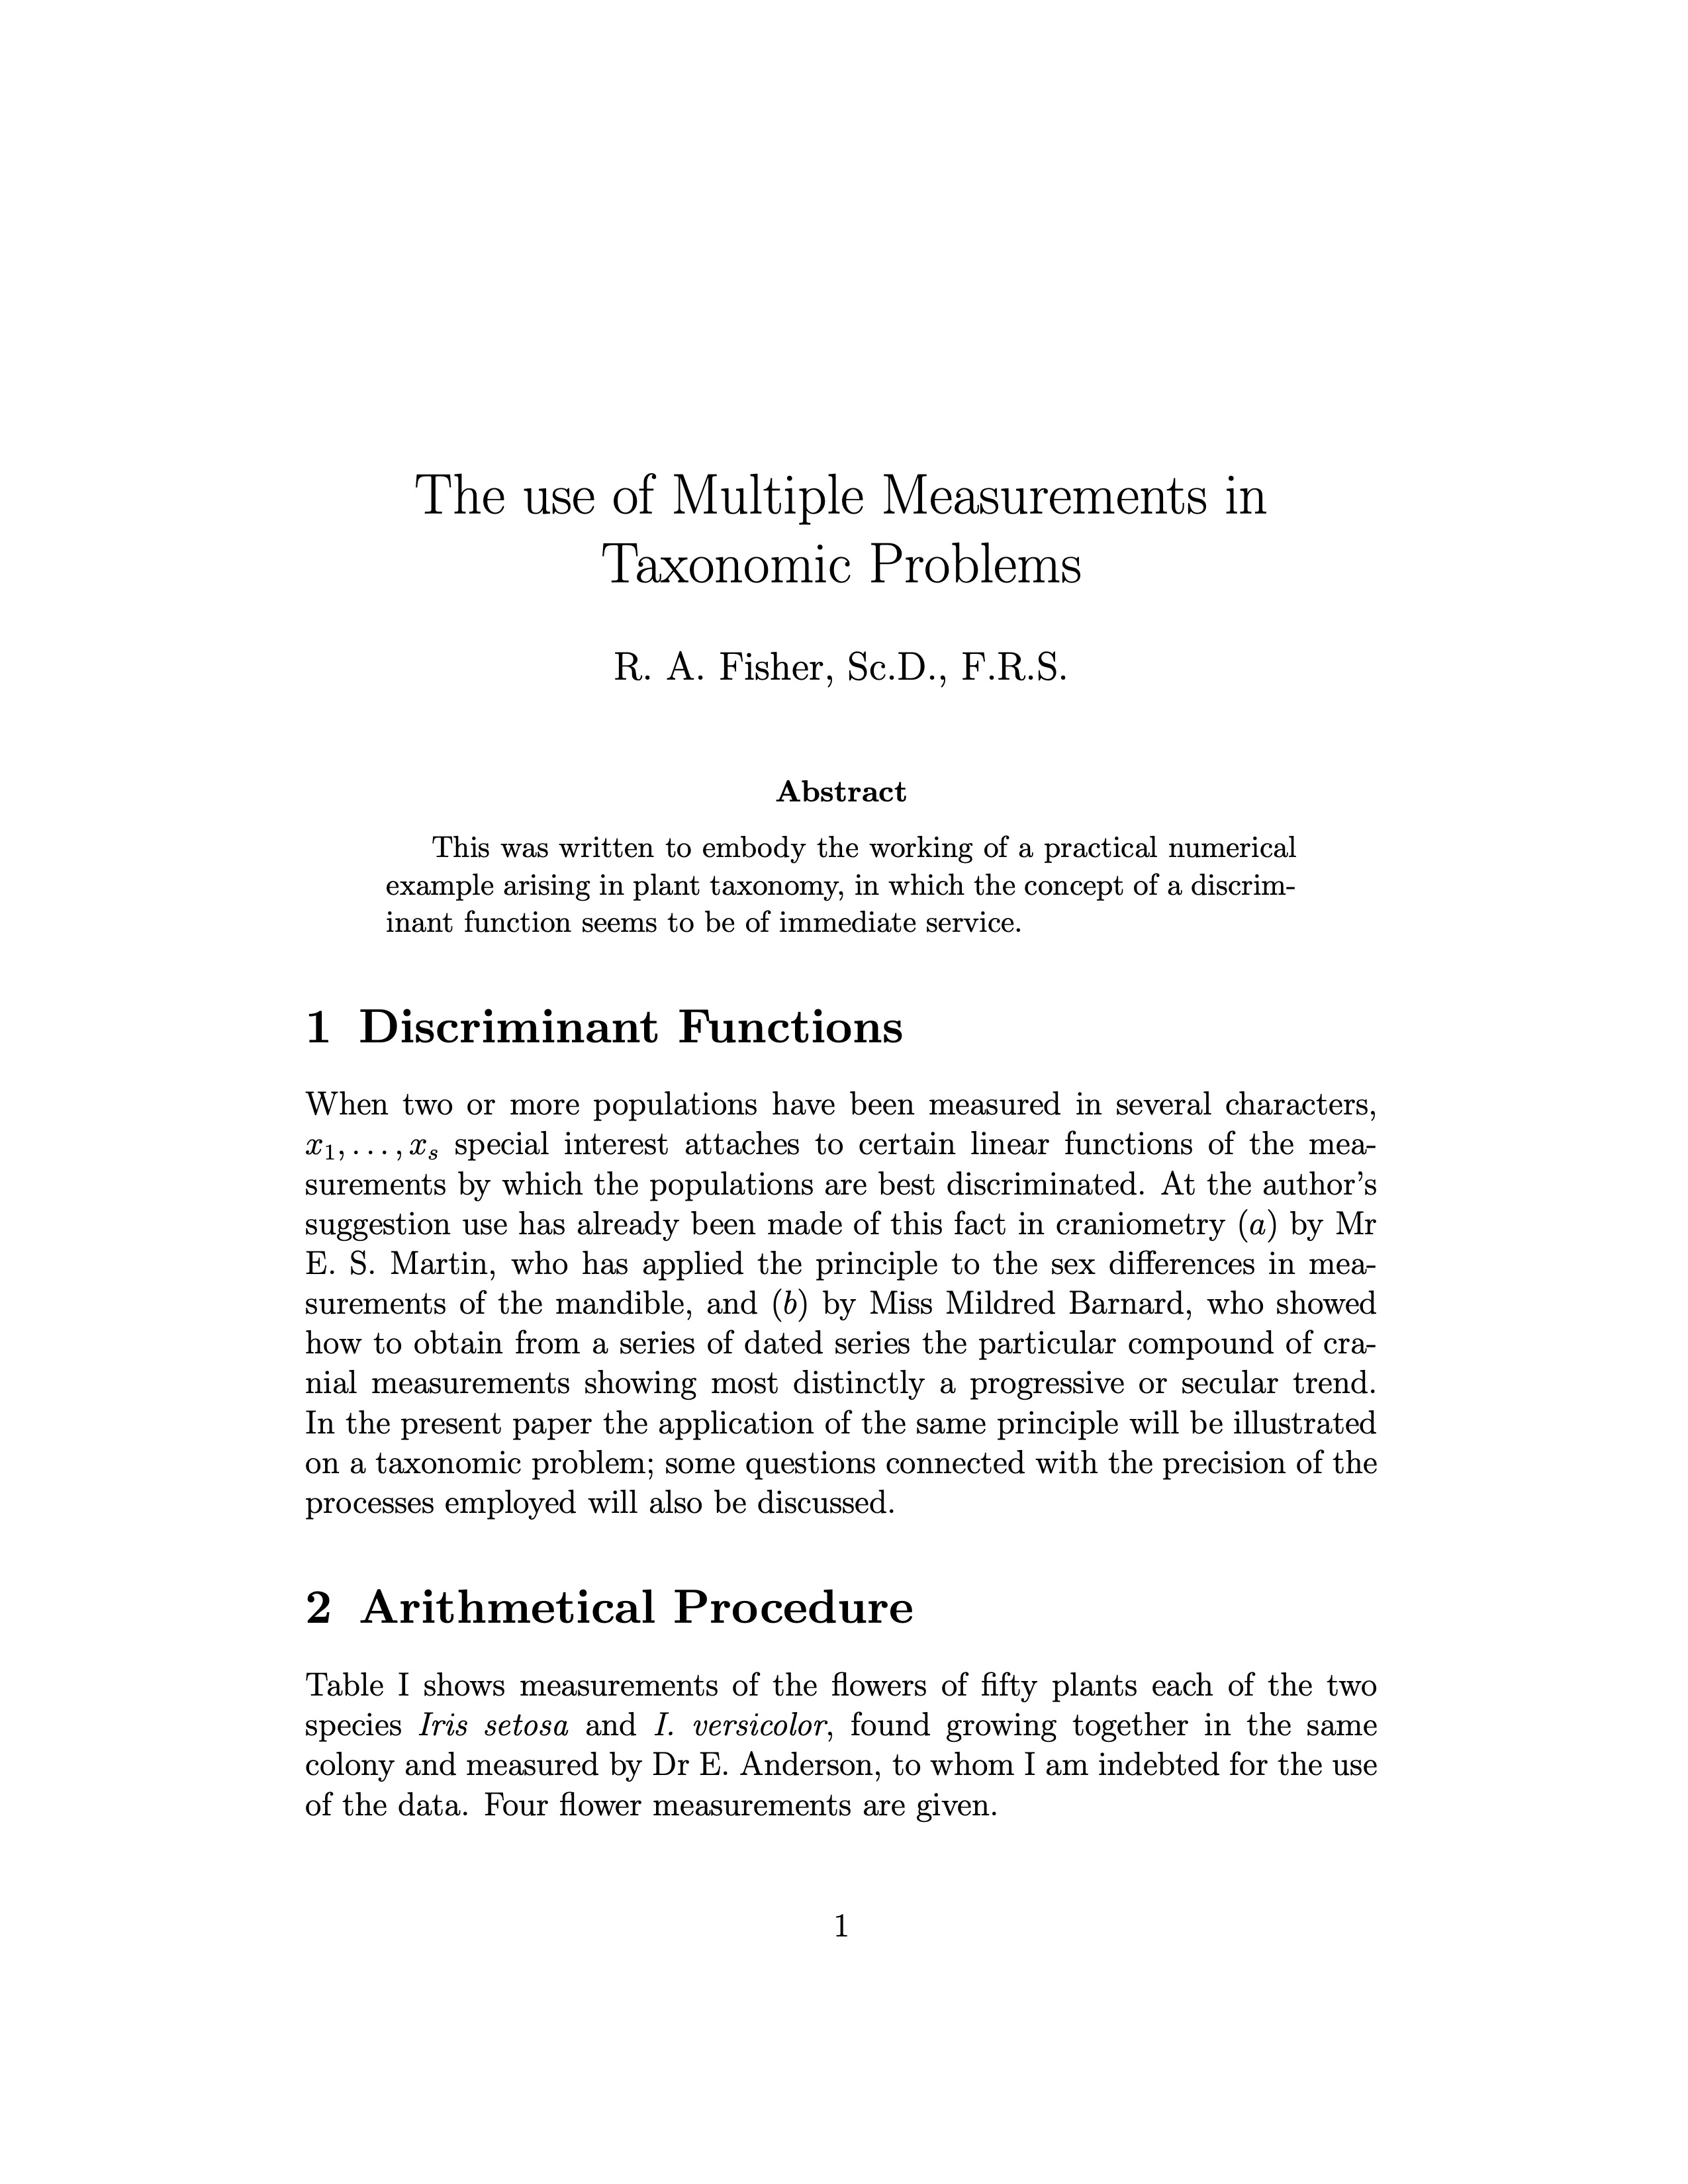
Figure 1. First page of the English version: title, author, and abstract.
Task
The task was to prepare an English version of a classic statistical paper in a format suitable for reading, review, and future editing. The main requirements were:
- build the document in LaTeX, not in a visual editor;
- support mathematical formulas and scientific names;
- typeset large numerical tables;
- include illustrations and diagrams;
- keep the TeX source public and verifiable;
- produce a PDF that works as a standalone article.
Technical Outline
- Format: LaTeX project for a scientific article.
- Languages: English and Russian versions in one repository; this case study shows the English version.
- Subject: Fisher's paper on discriminant functions and the iris data set.
- Output: PDF and source
.texfile. - Source publishing: GitHub + raw link to the TeX file.
What Mattered in the Typesetting
The complexity of this document is not one isolated formula, but the combination of different content types. A single article may contain scientific prose, Latin species names, multi-line formulas, large tables, and references to numbered tables or equations. The LaTeX project therefore needs to be treated as a technical document, not as a set of manual visual fixes.
For example, the preamble sets up mathematical packages, table support, graphics, and TikZ:
\documentclass[12pt]{article}
\usepackage{amsmath}
\usepackage{booktabs}
\usepackage{tabularx}
\usepackage{graphicx}
\usepackage{float}
\usepackage{tikz}
Formulas are kept as proper display blocks so they remain readable and compile reliably:
\[
X = \lambda_{1} x_{1} + \lambda_{2} x_{2}
  + \lambda_{3} x_{3} + \lambda_{4} x_{4}
\]
Large tables use tabularx. This helps keep the table inside the page width and avoids manual column tuning after text or font changes.
\begin{table}[H]
\centering
\footnotesize
\caption{Sums of squares and products of four measurements}
\label{tab:3}
\begin{tabularx}{\textwidth}{|*{5}{>{\centering\arraybackslash}X|}}
...
\end{tabularx}
\end{table}
TikZ: Power and Challenges
The project also includes a separate TikZ file for the diagram with distributions and mean values: raw tikz_fisher.tex. This is an important part of the LaTeX work: the figure is not a random inserted bitmap, but code that can be rebuilt, inspected, and changed.
The power of TikZ is that graphics become part of the document source. If intervals, labels, arrow coordinates, or scale need to change, the update happens in code instead of a manual image editor. For scientific and educational materials, this is especially useful because the diagram remains reproducible and connected to the data.
The challenge is that TikZ requires engineering discipline. Coordinates, scale, loops, labels, element overlap, and PDF readability all need attention. A small mistake in one coefficient can visually move an arrow or make bars inconsistent.
\foreach \i/\v in {
1/6,2/5,3/10,4/5,5/9,6/7,7/4,8/2,9/1,10/1}
{
  \pgfmathsetmacro{\xleft}{(\xmina + (\i-1)*\wa)/10}
  \pgfmathsetmacro{\xright}{(\xmina + \i*\wa)/10}
  \draw[] (\xleft,10pt-6pt) rectangle
    (\xright, 10pt -6pt+ \cella*\v);
}
This snippet shows the approach: values are defined as a list, and rectangles are generated in a loop. That style fits documents where a figure should be verifiable, not decorative: the construction logic can be recovered and the result can be repeated without manual redrawing.
Result
- An English LaTeX document was built as a 13-page article.
- The source contains formulas, tables, references, illustrations, and a TikZ diagram workflow.
- The raw TeX source is public: raw fisher.tex.
- The project works as a practical example for scientific, educational, and data-heavy document typesetting.
- The case study is connected to the LaTeX typesetting service.
All Pages of the English Article
Below are all pages of the compiled English version. Each page can be opened separately.
Page 1. English LaTeX version of Fisher's paper.
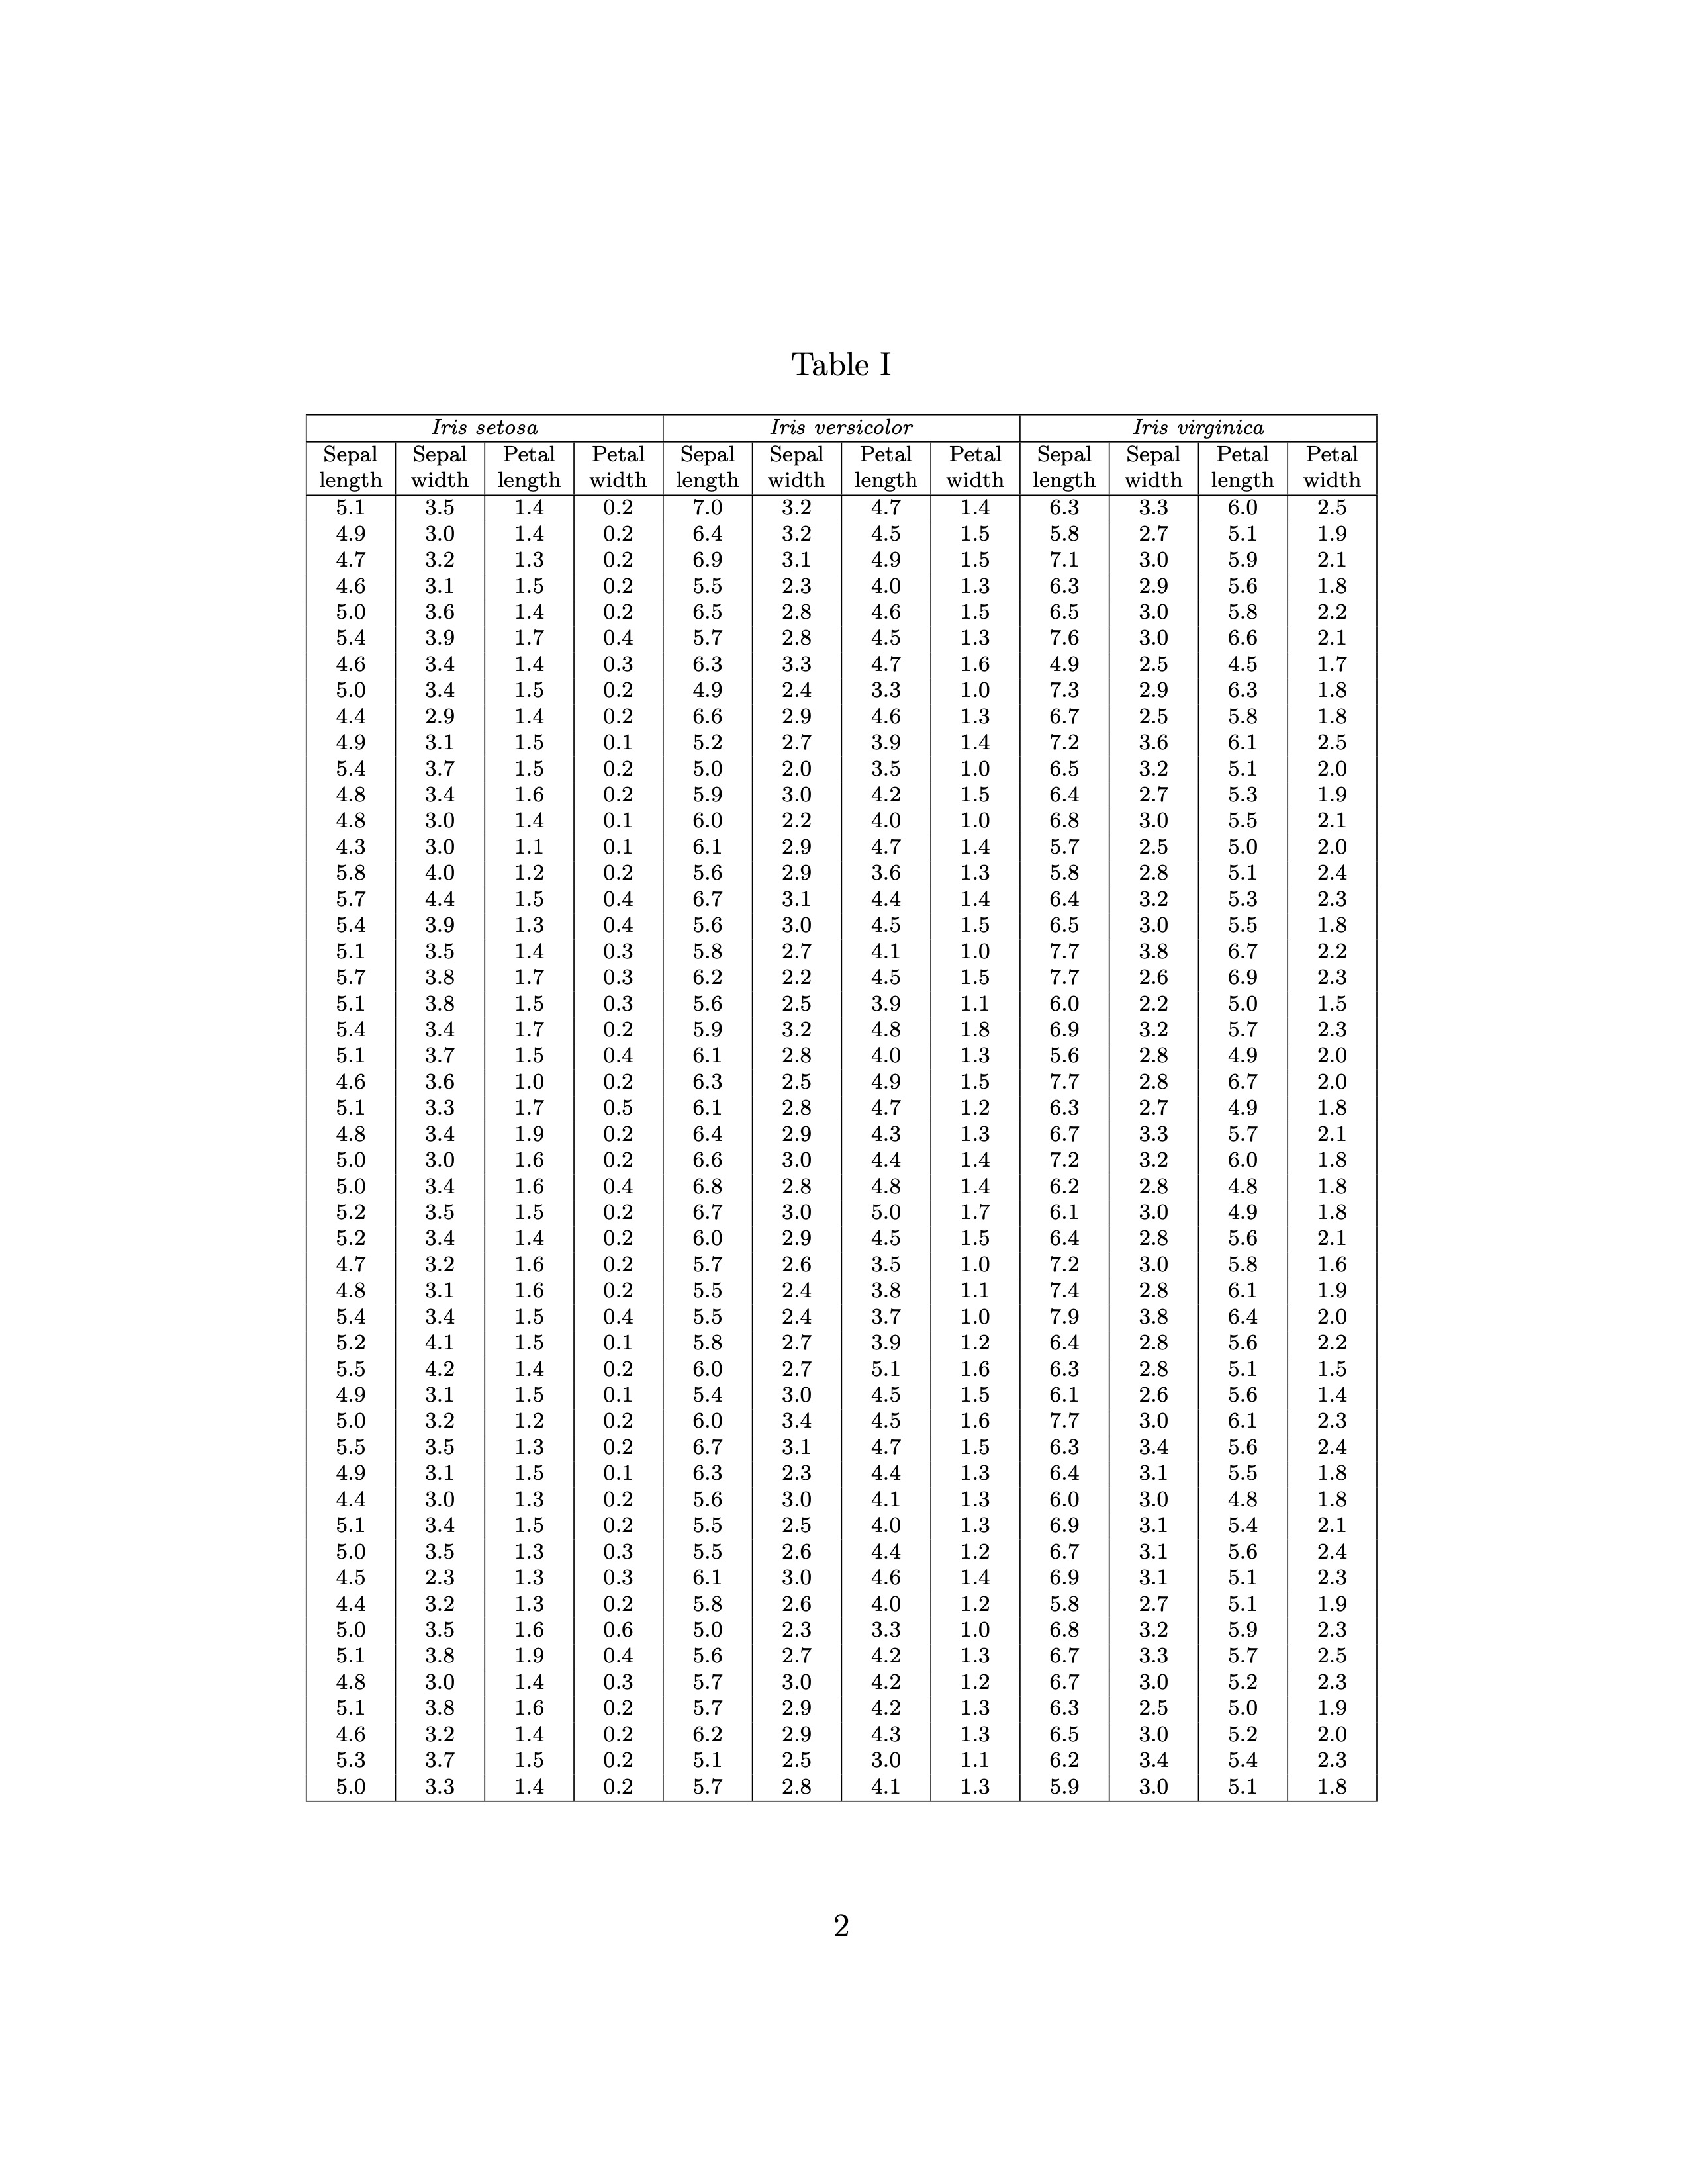
Page 2. English LaTeX version of Fisher's paper.
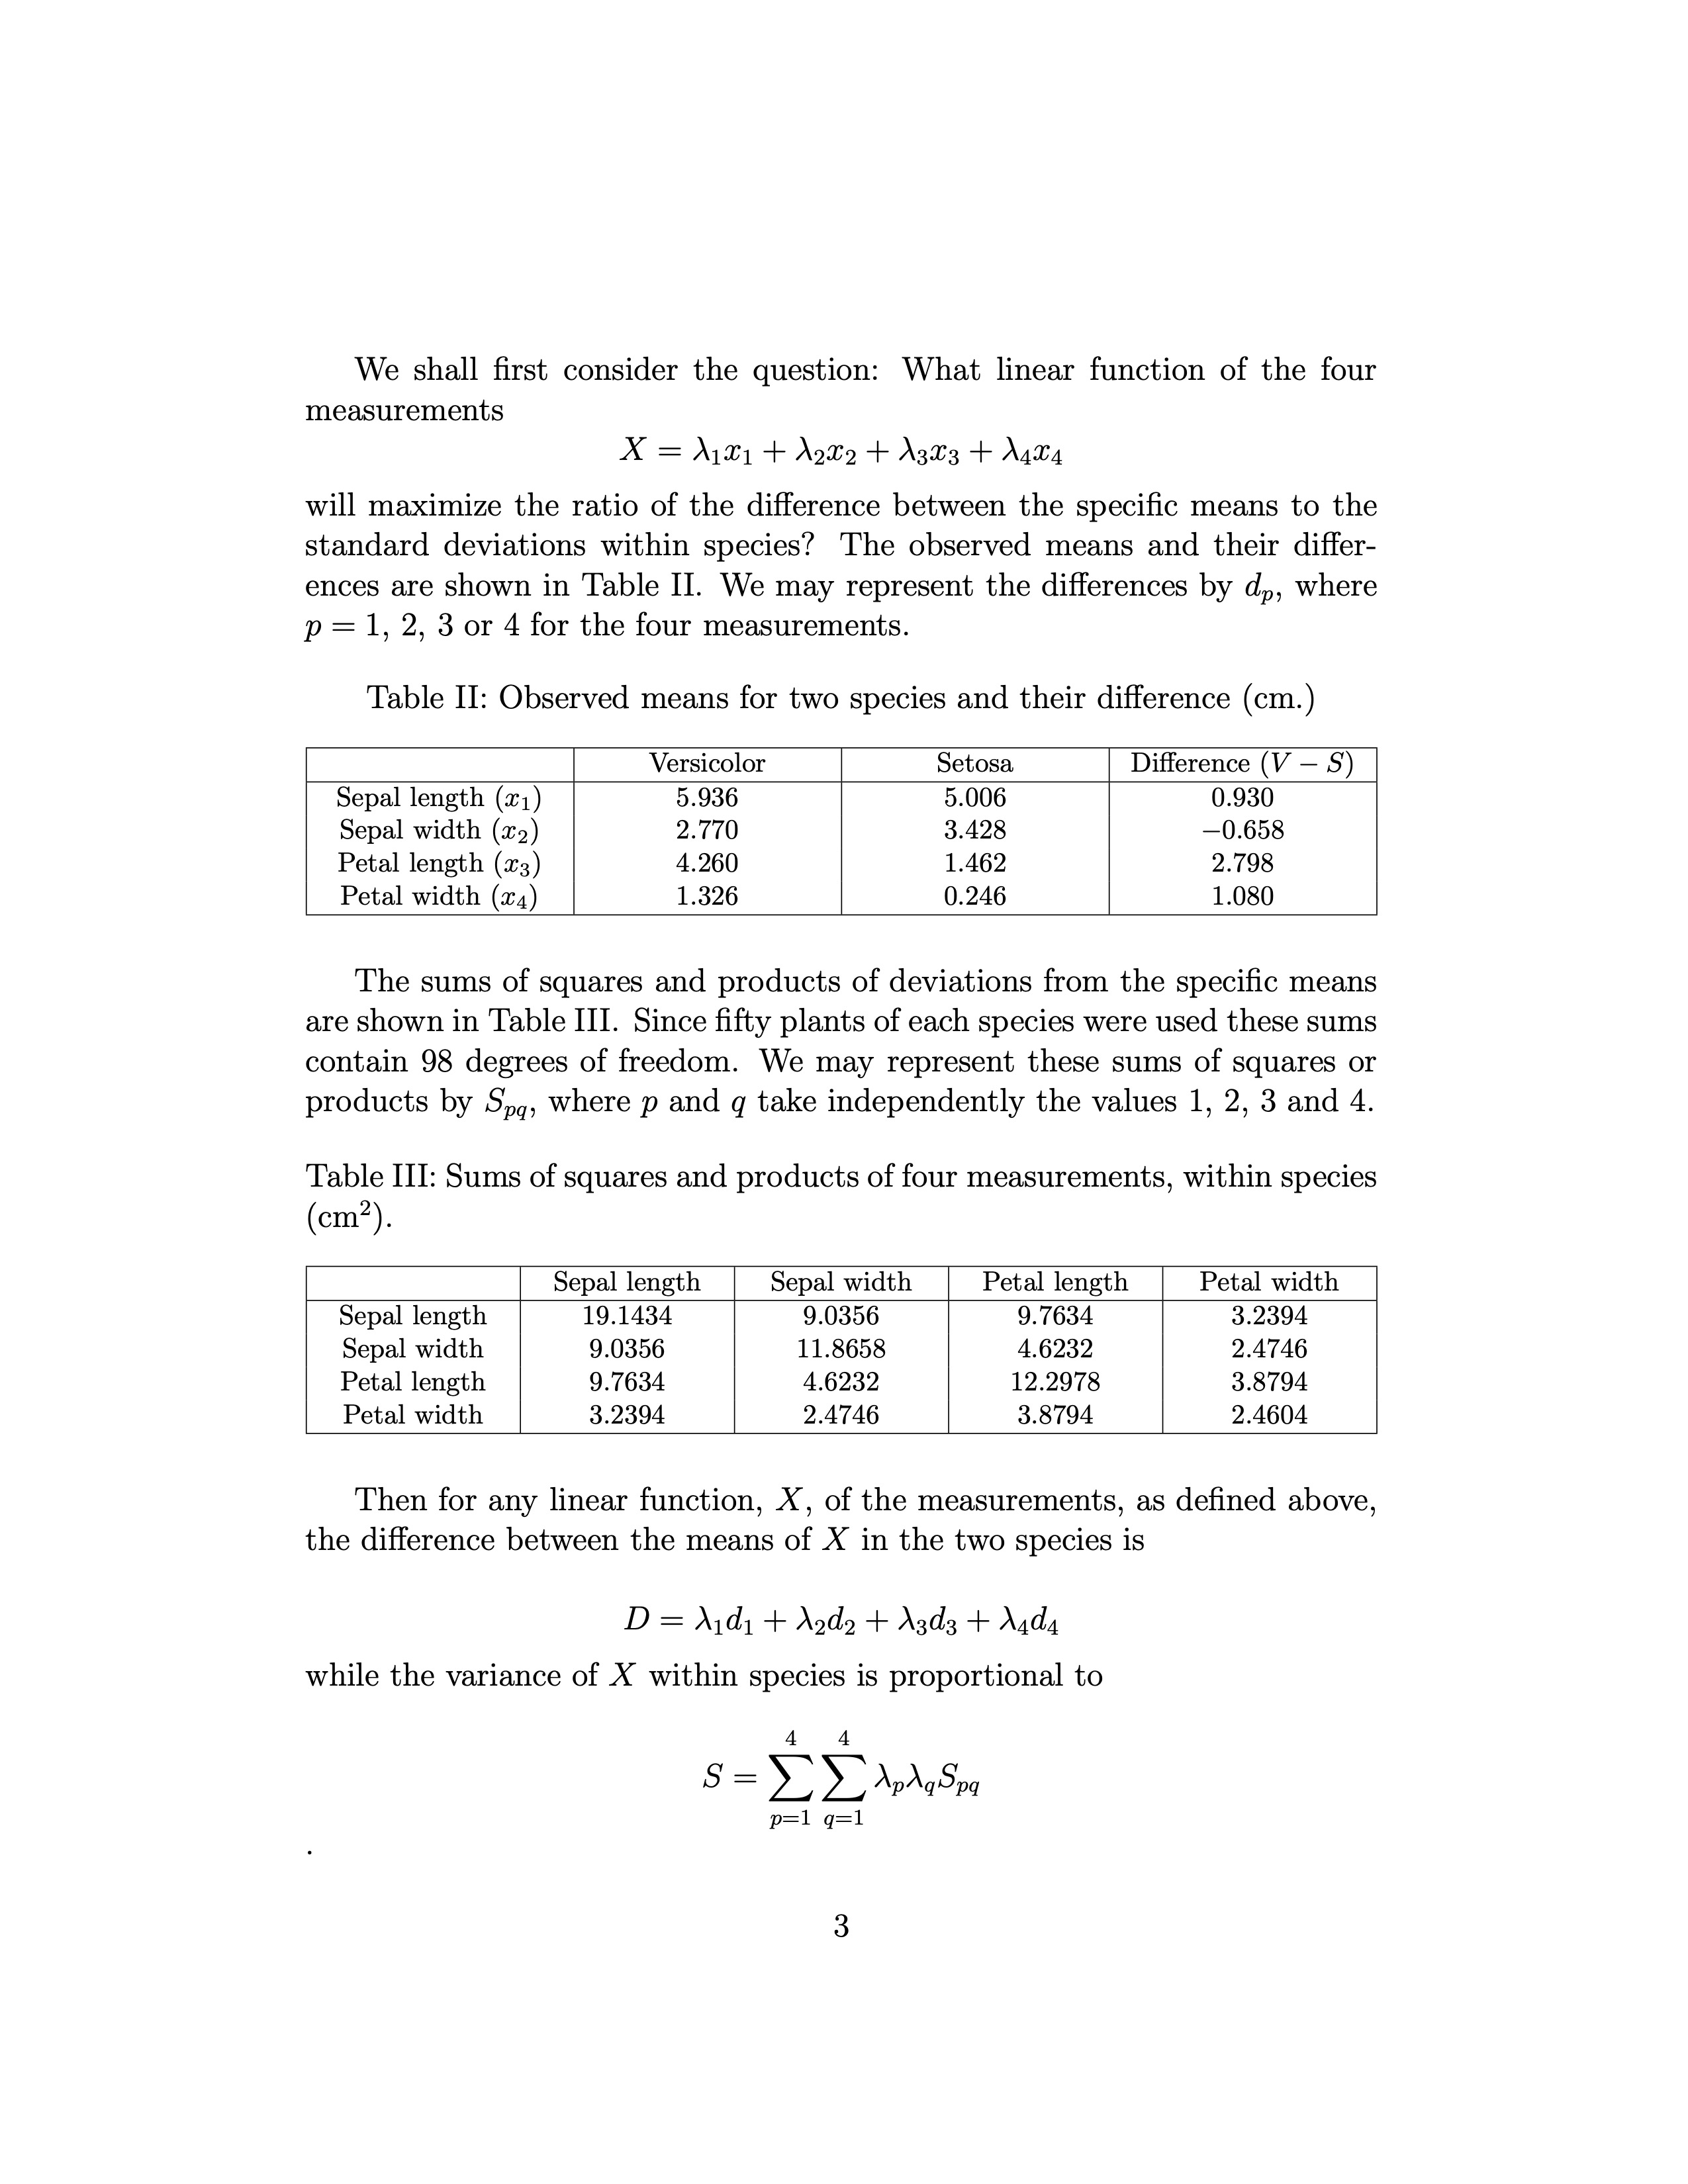
Page 3. English LaTeX version of Fisher's paper.
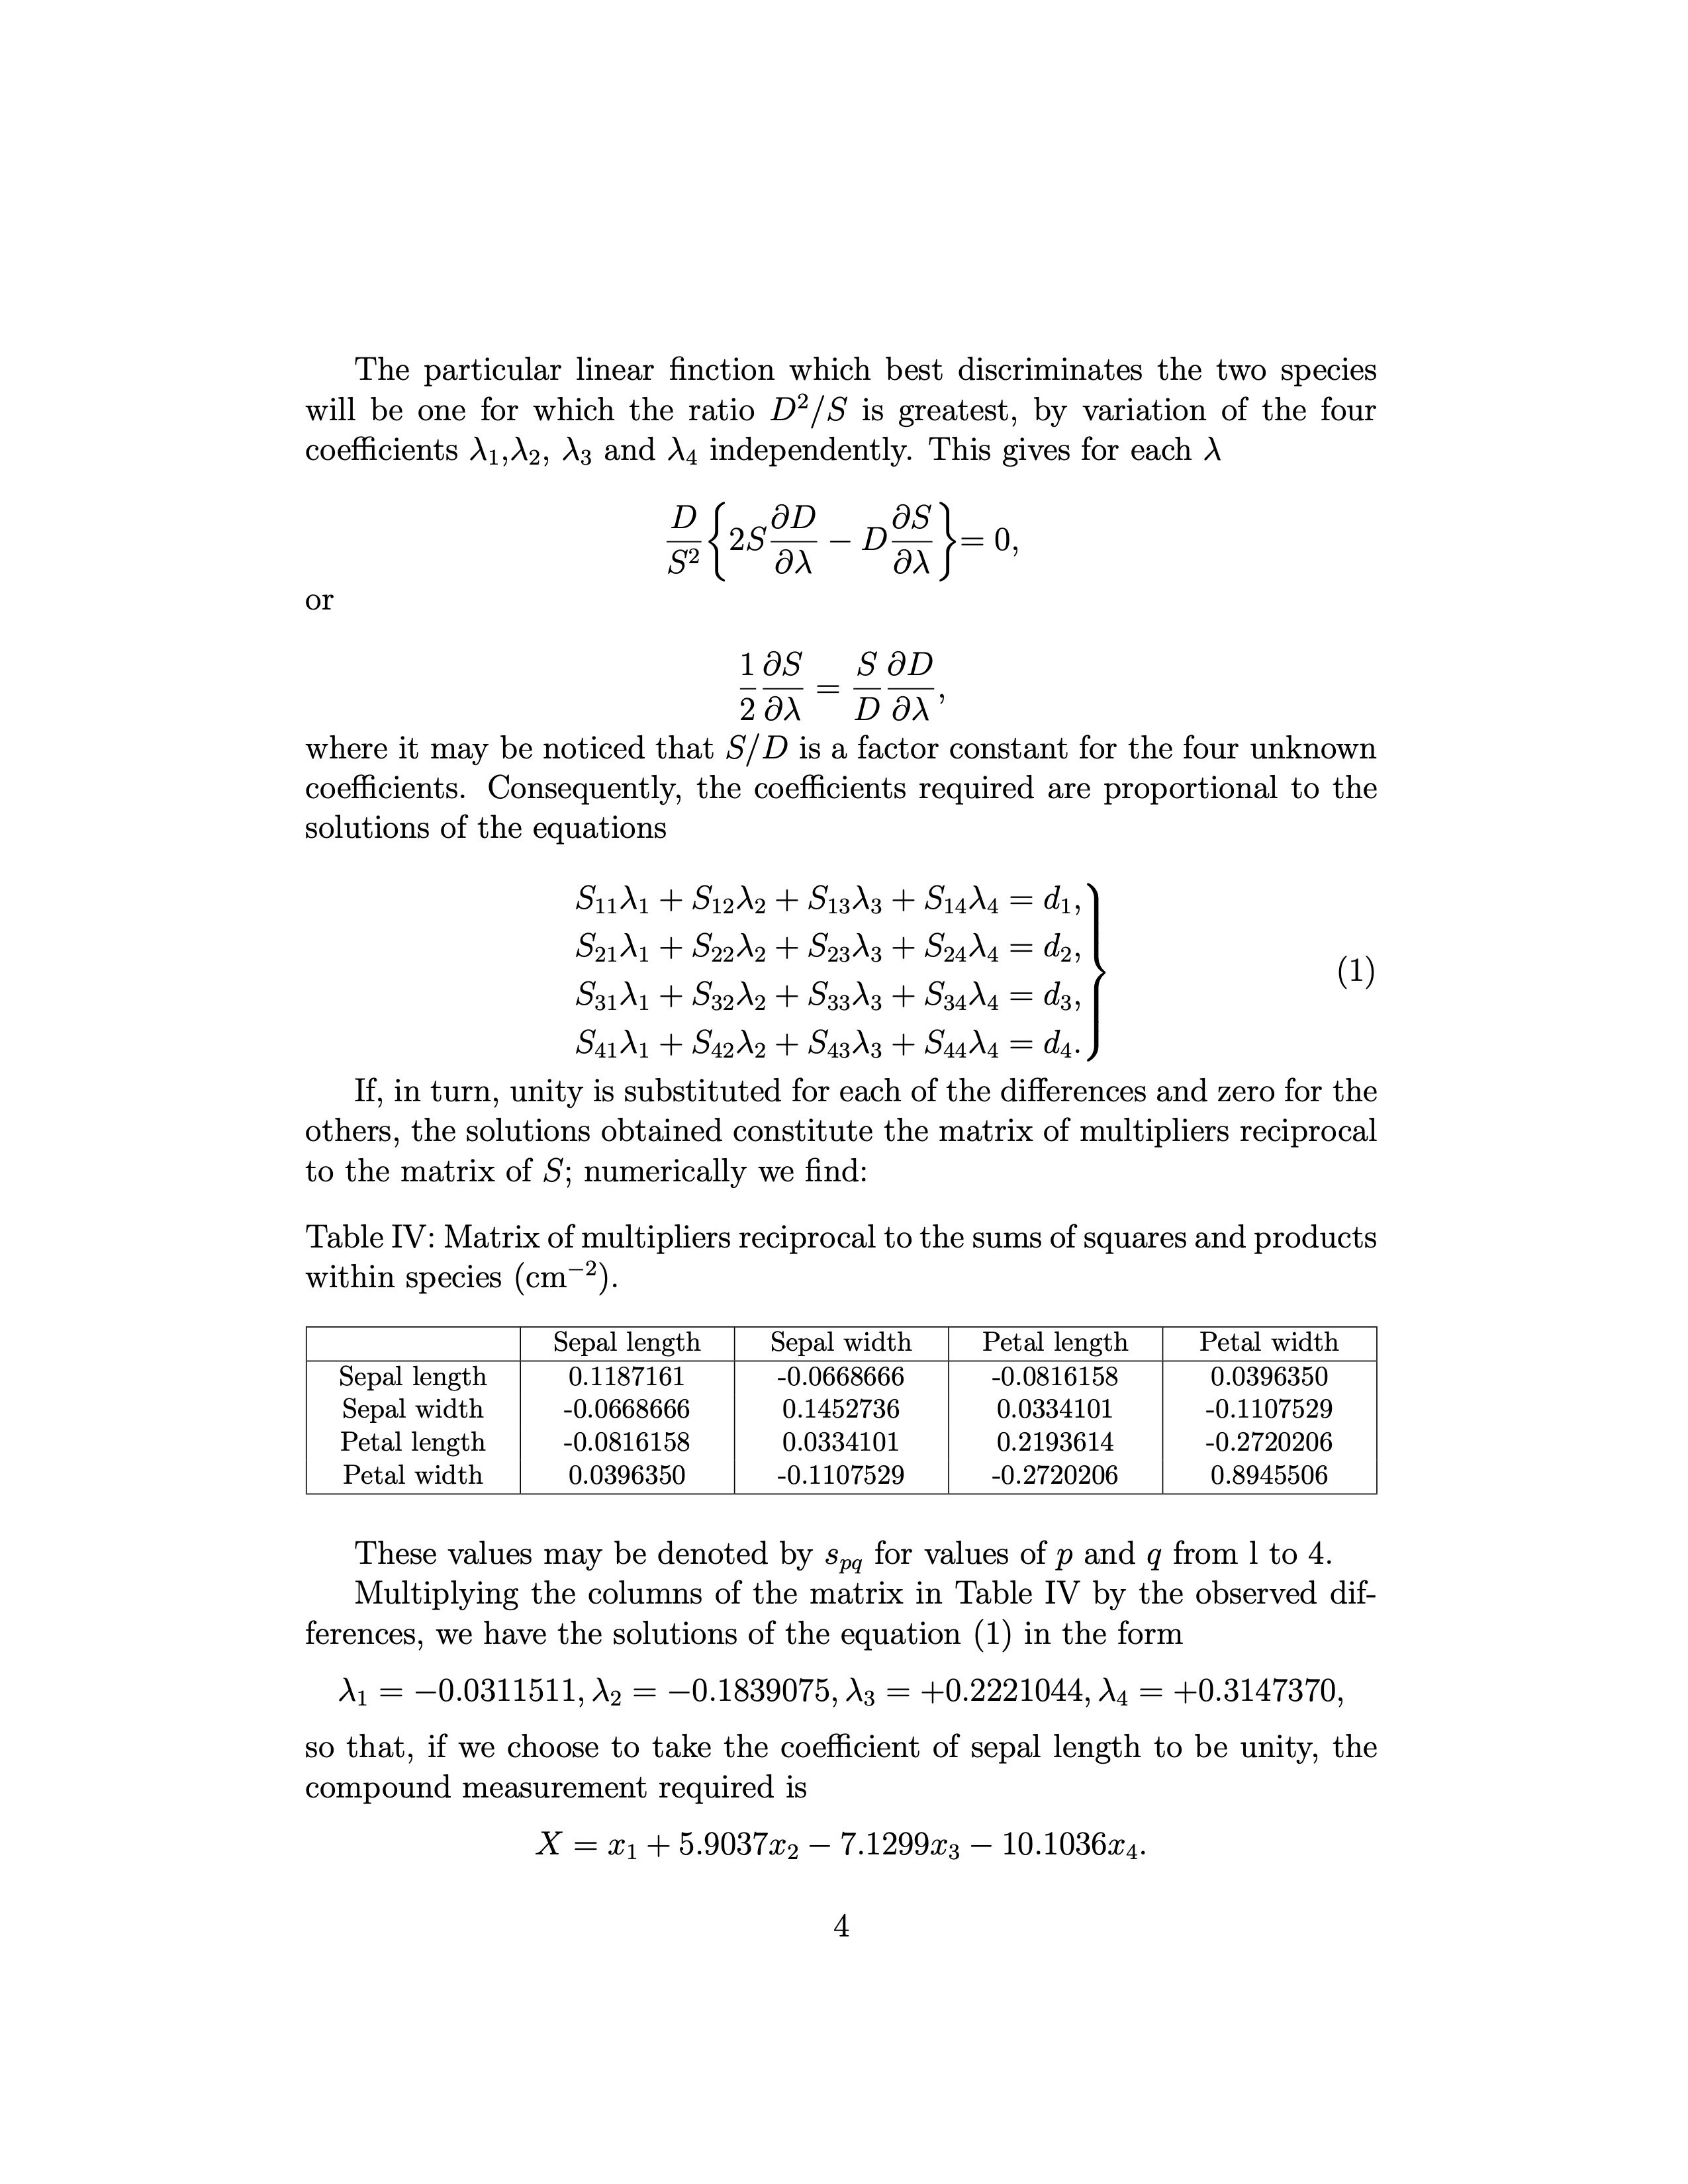
Page 4. English LaTeX version of Fisher's paper.
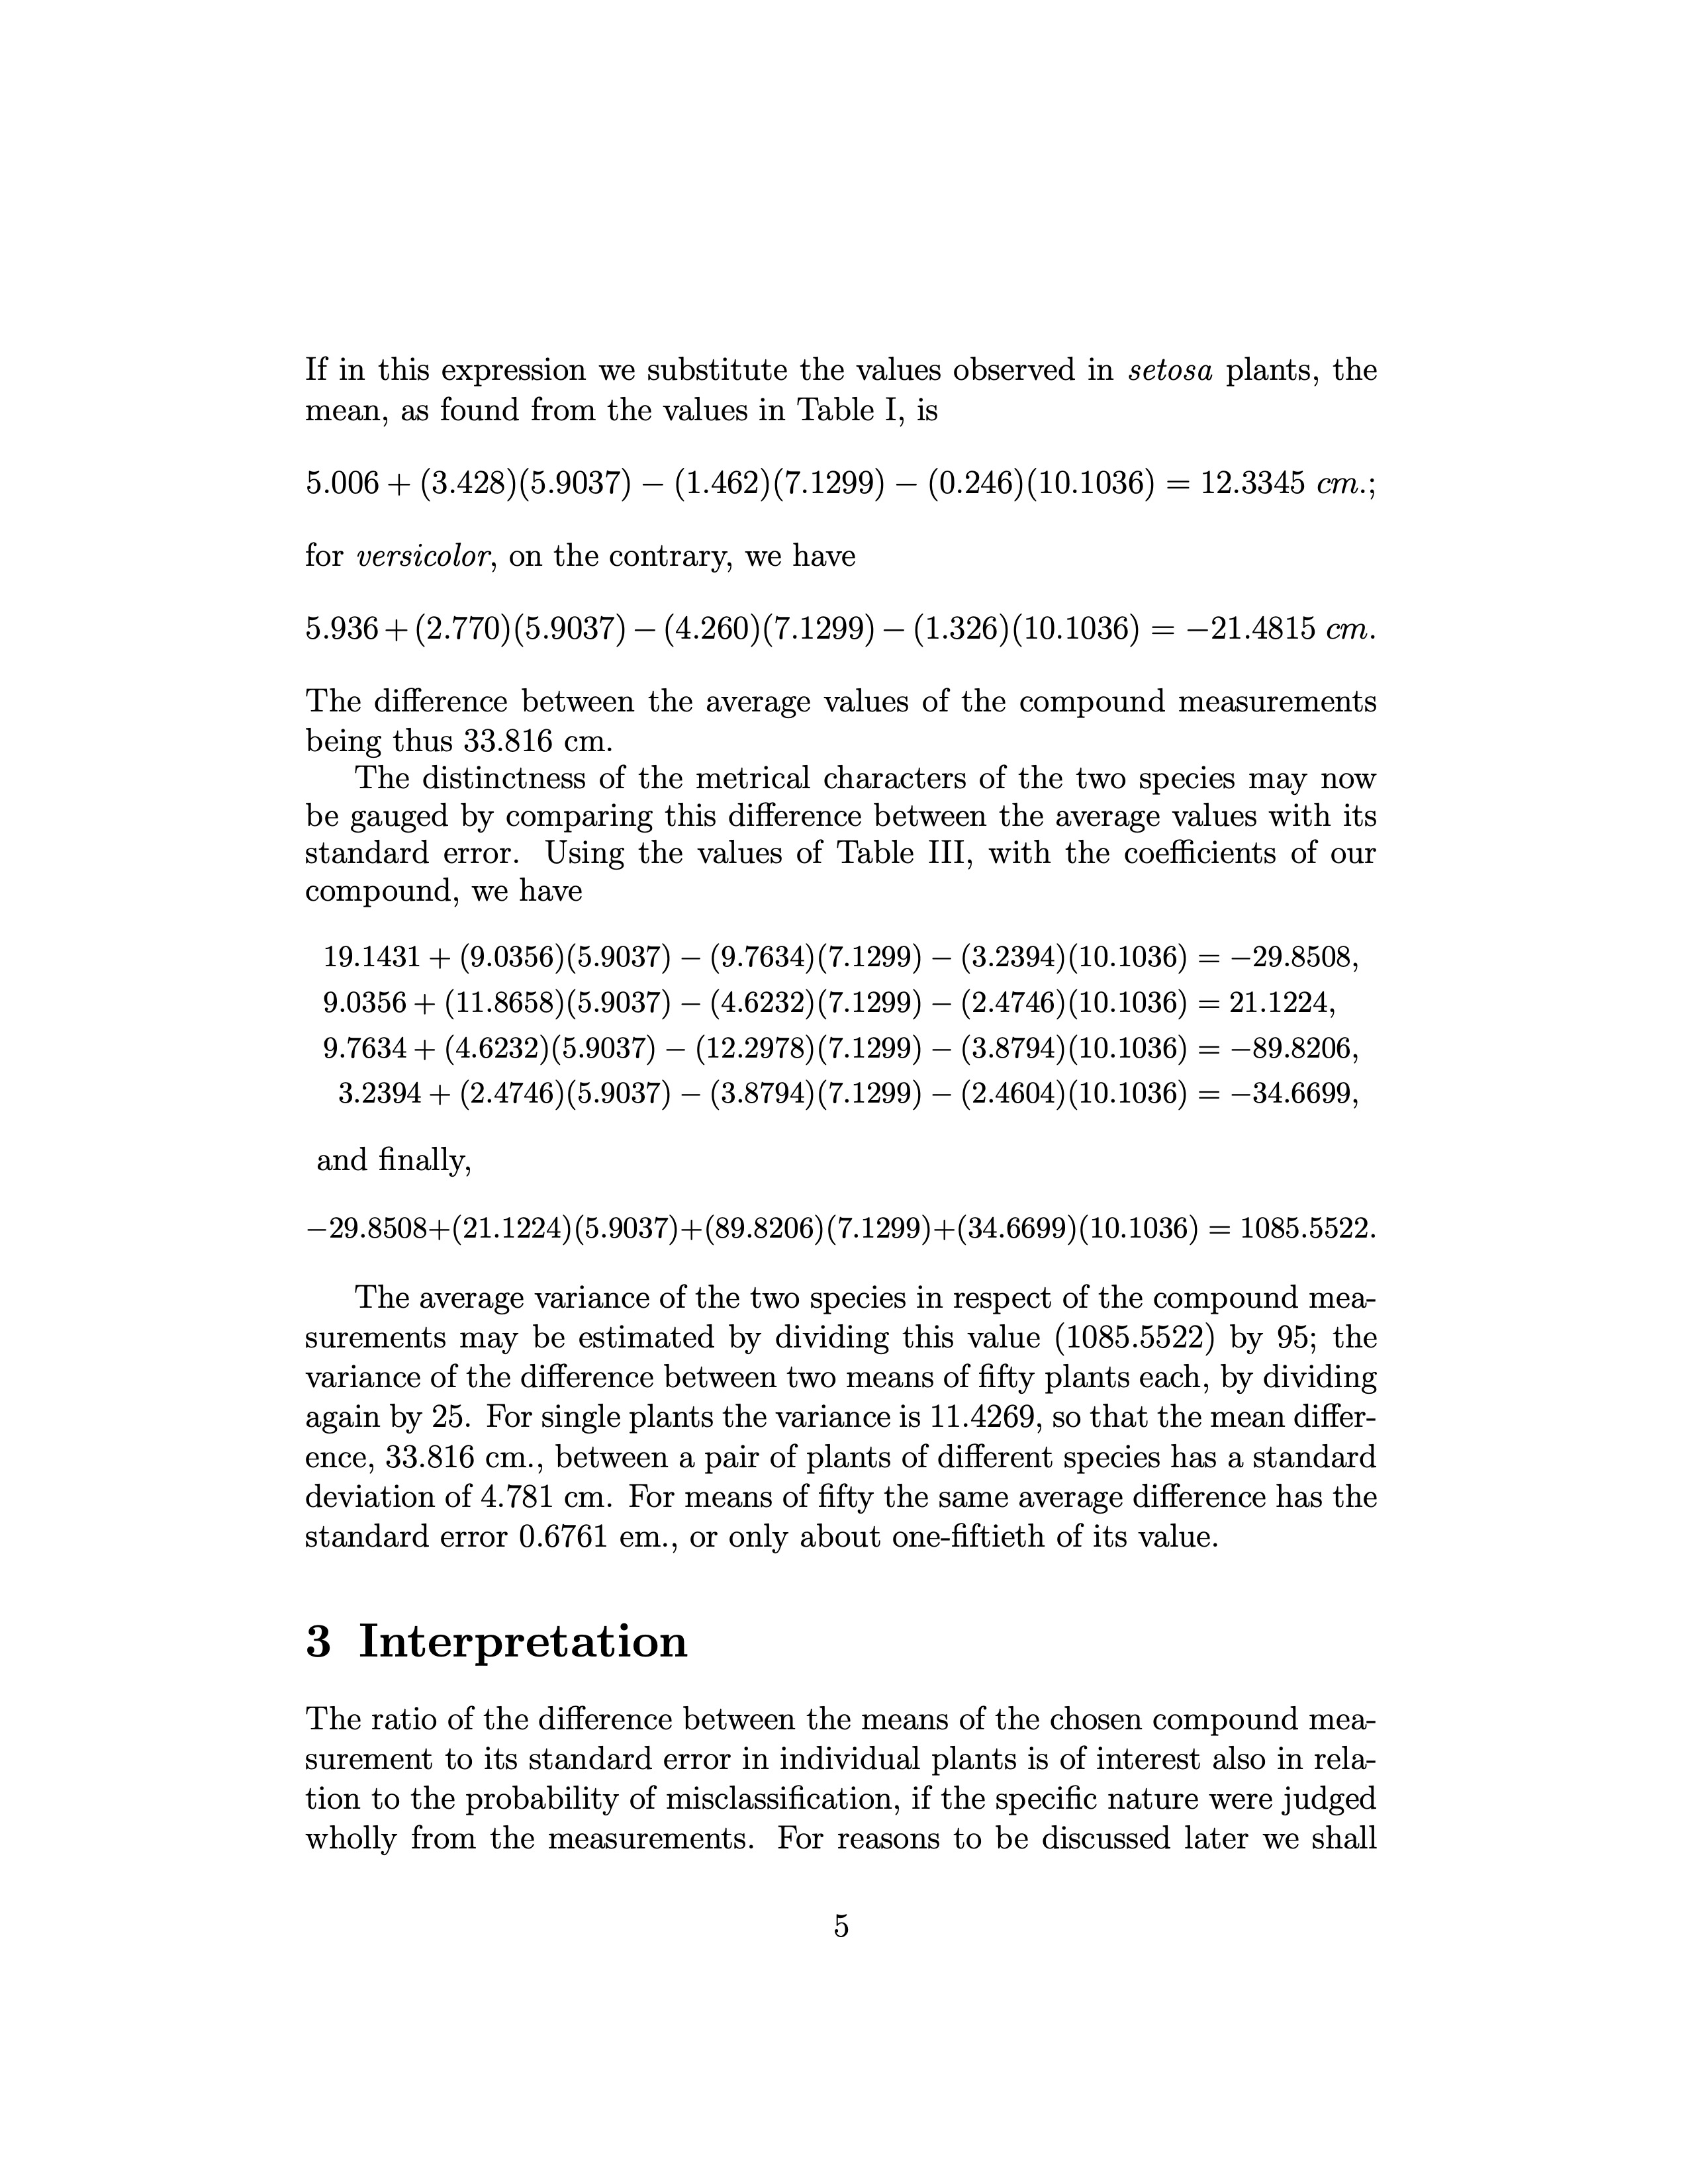
Page 5. English LaTeX version of Fisher's paper.
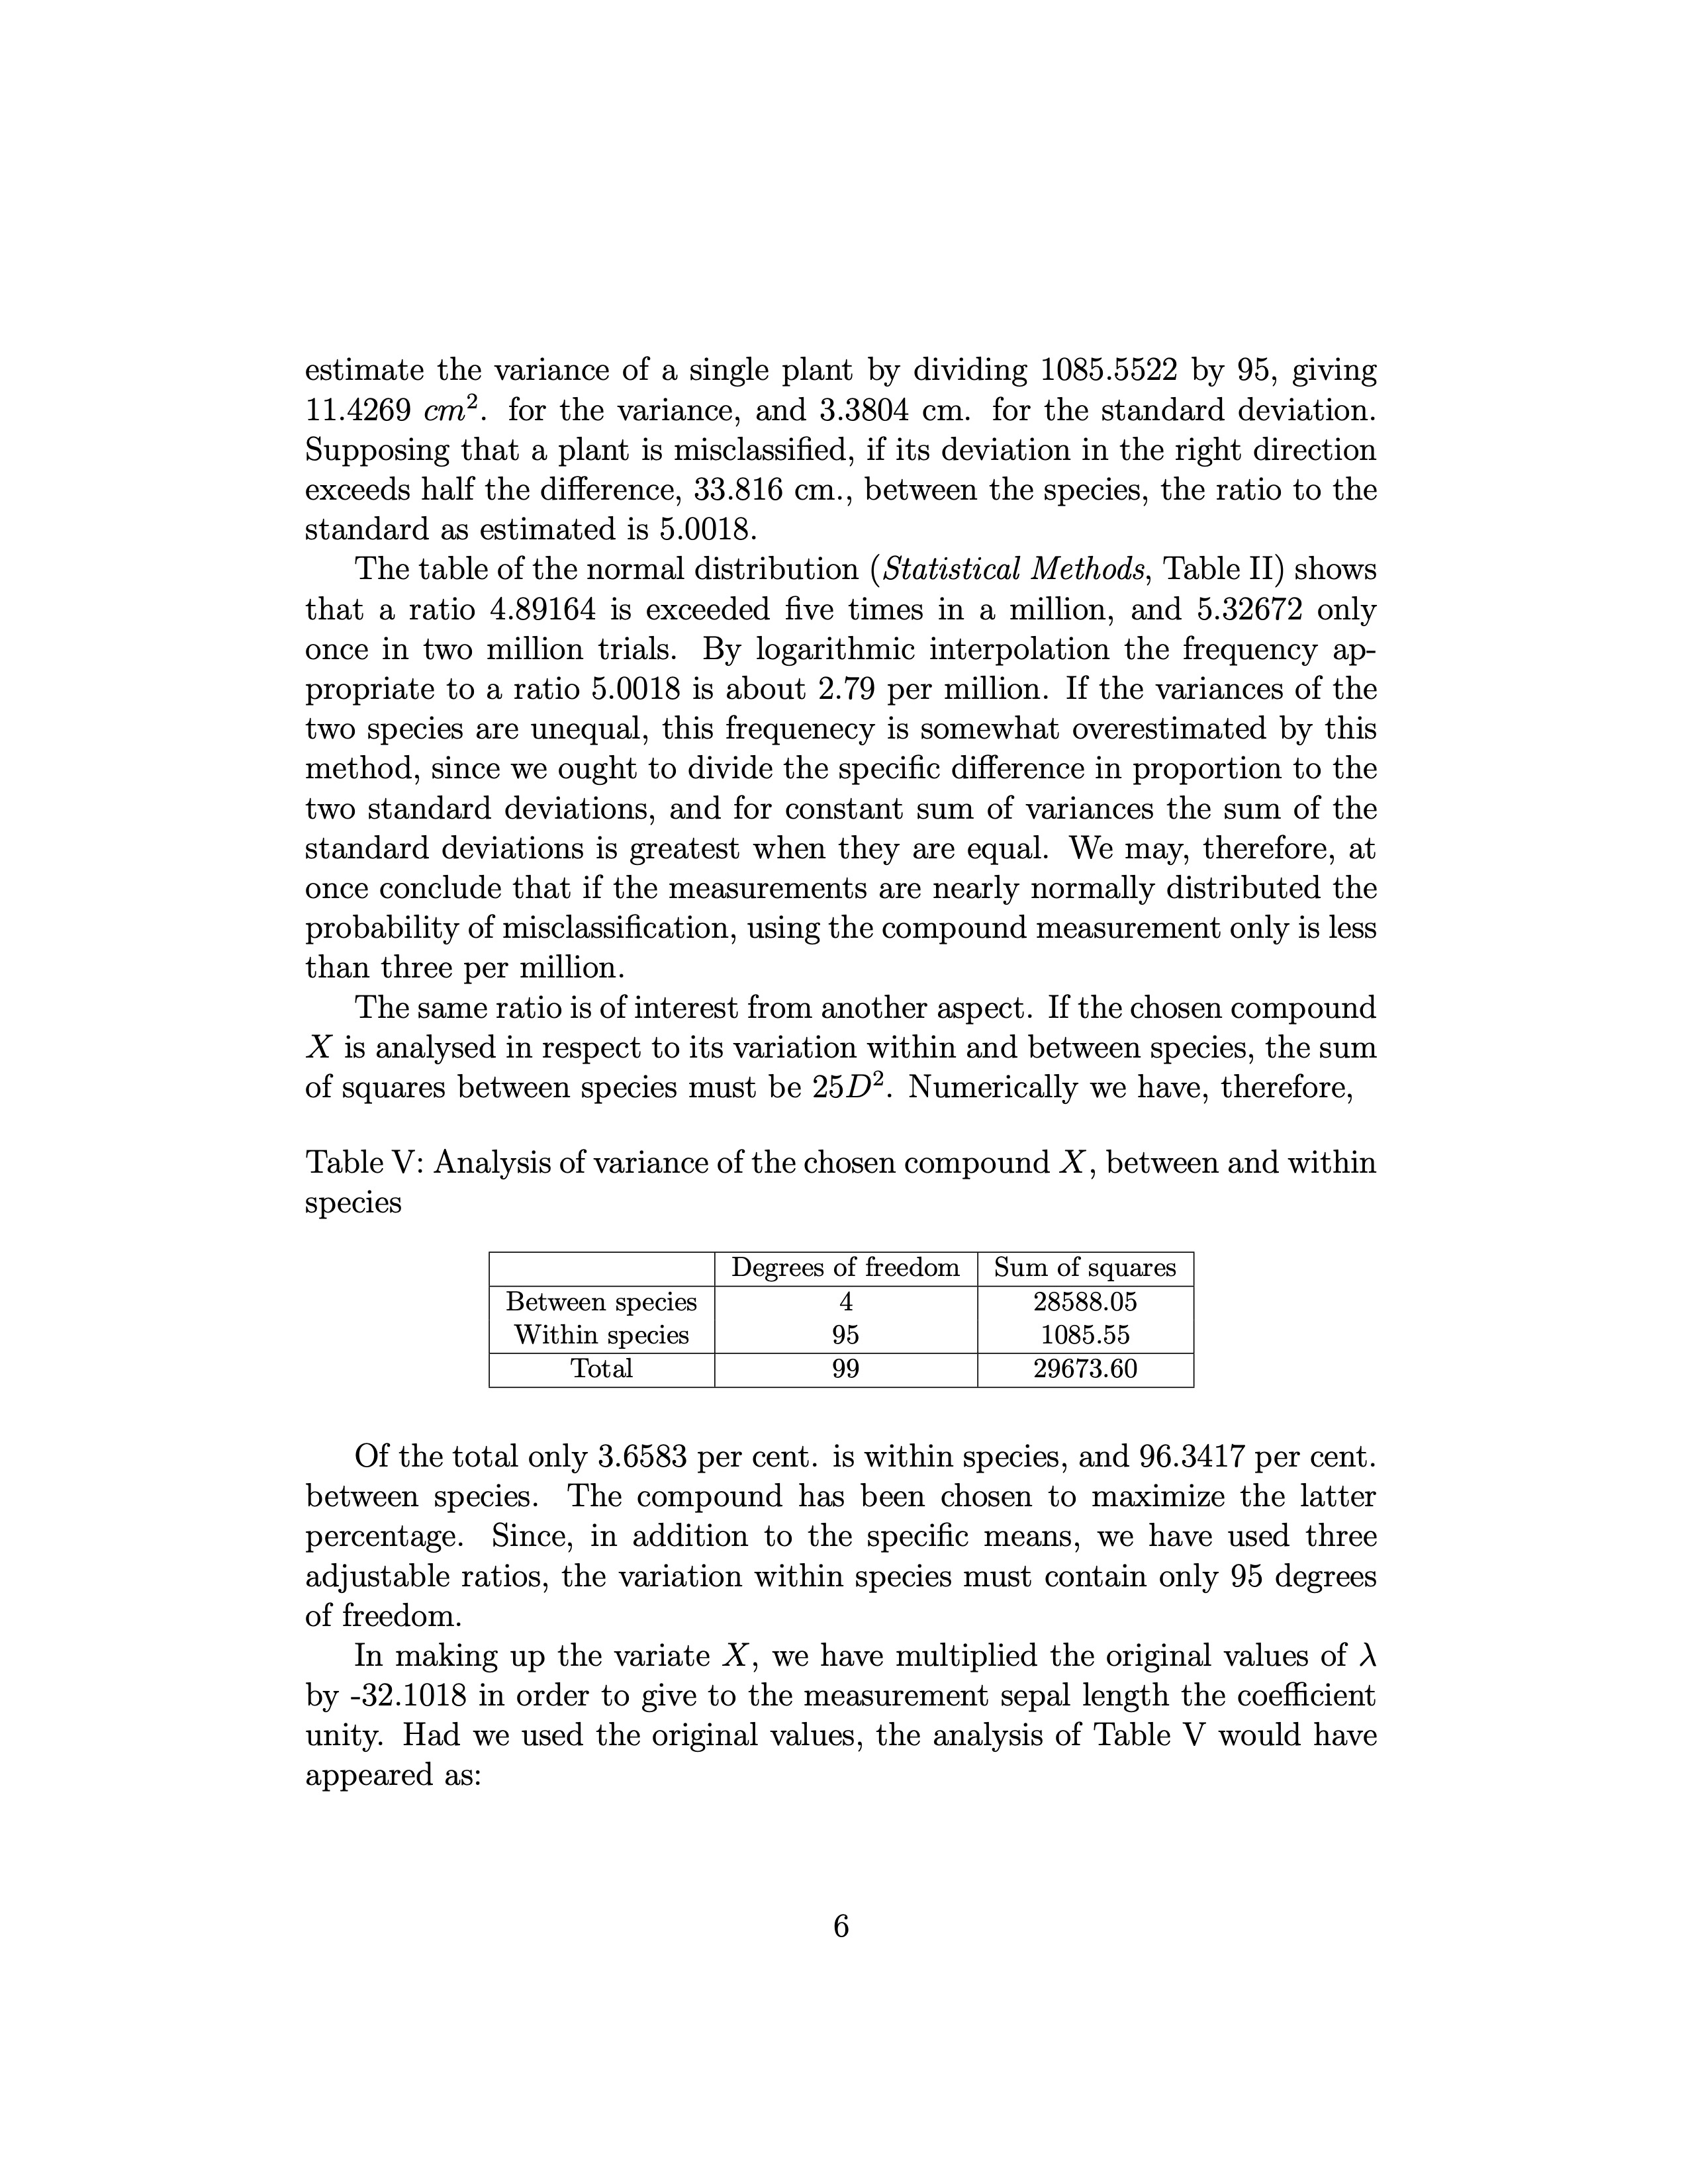
Page 6. English LaTeX version of Fisher's paper.
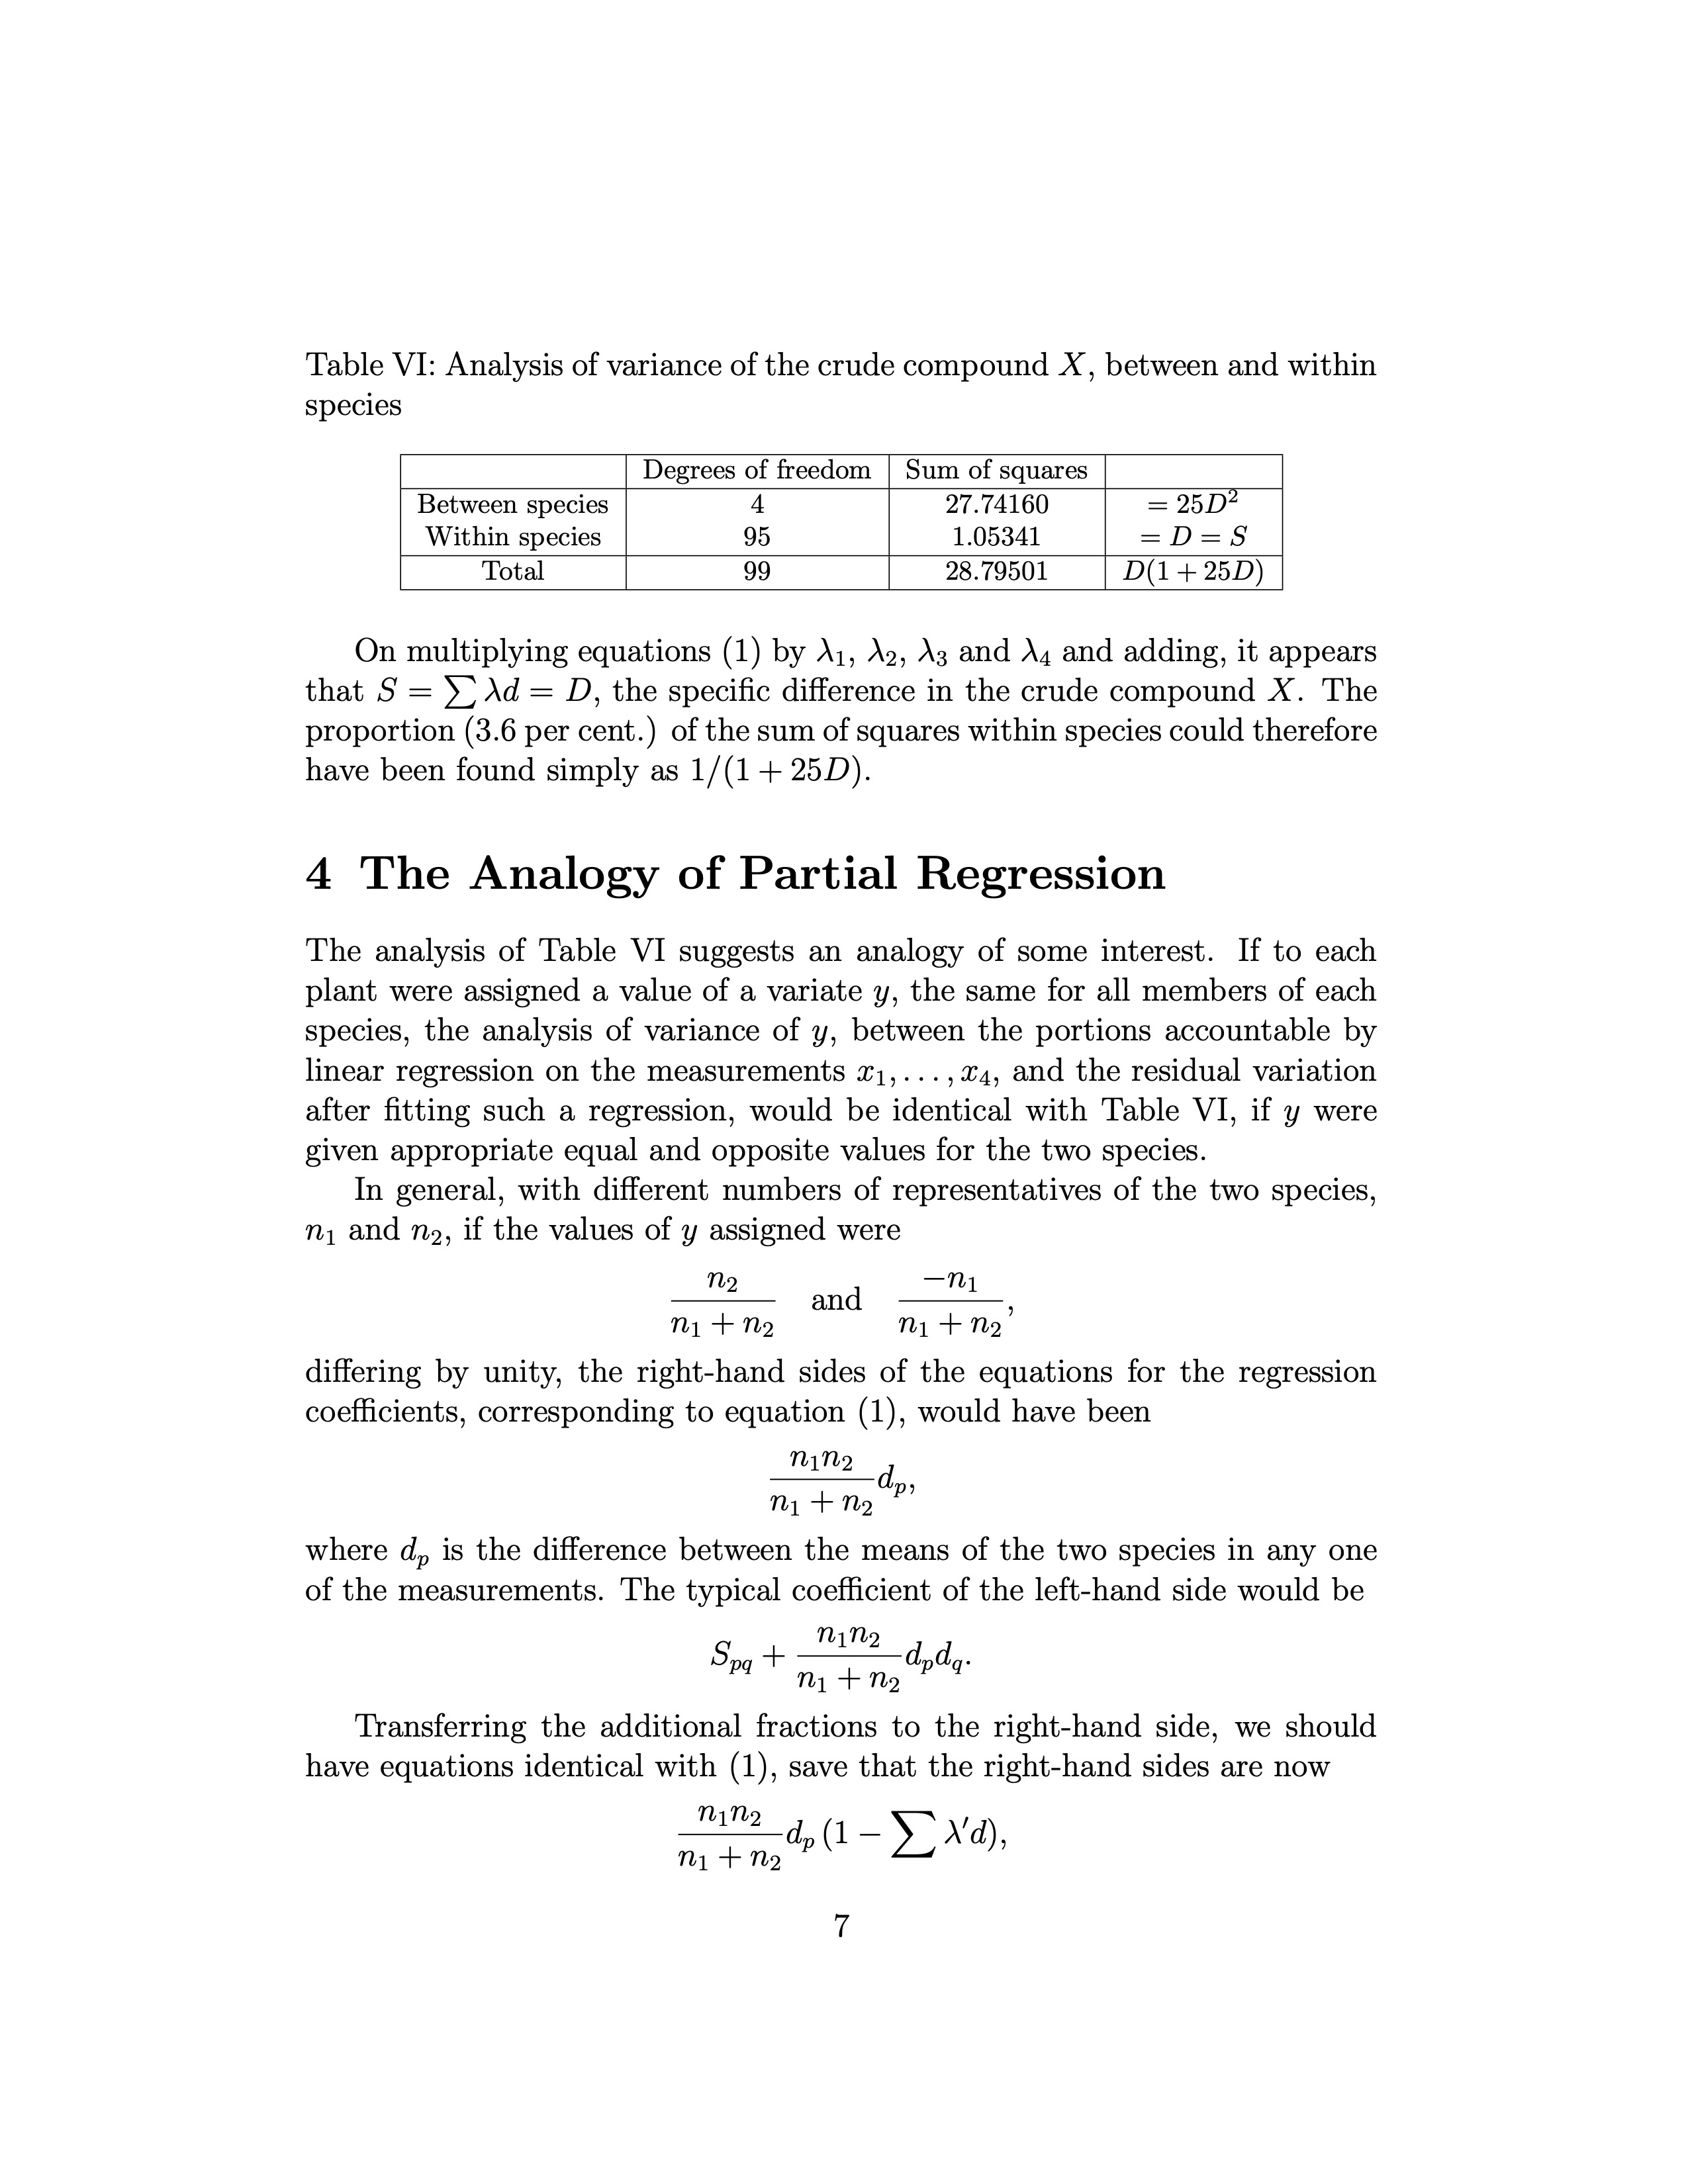
Page 7. English LaTeX version of Fisher's paper.
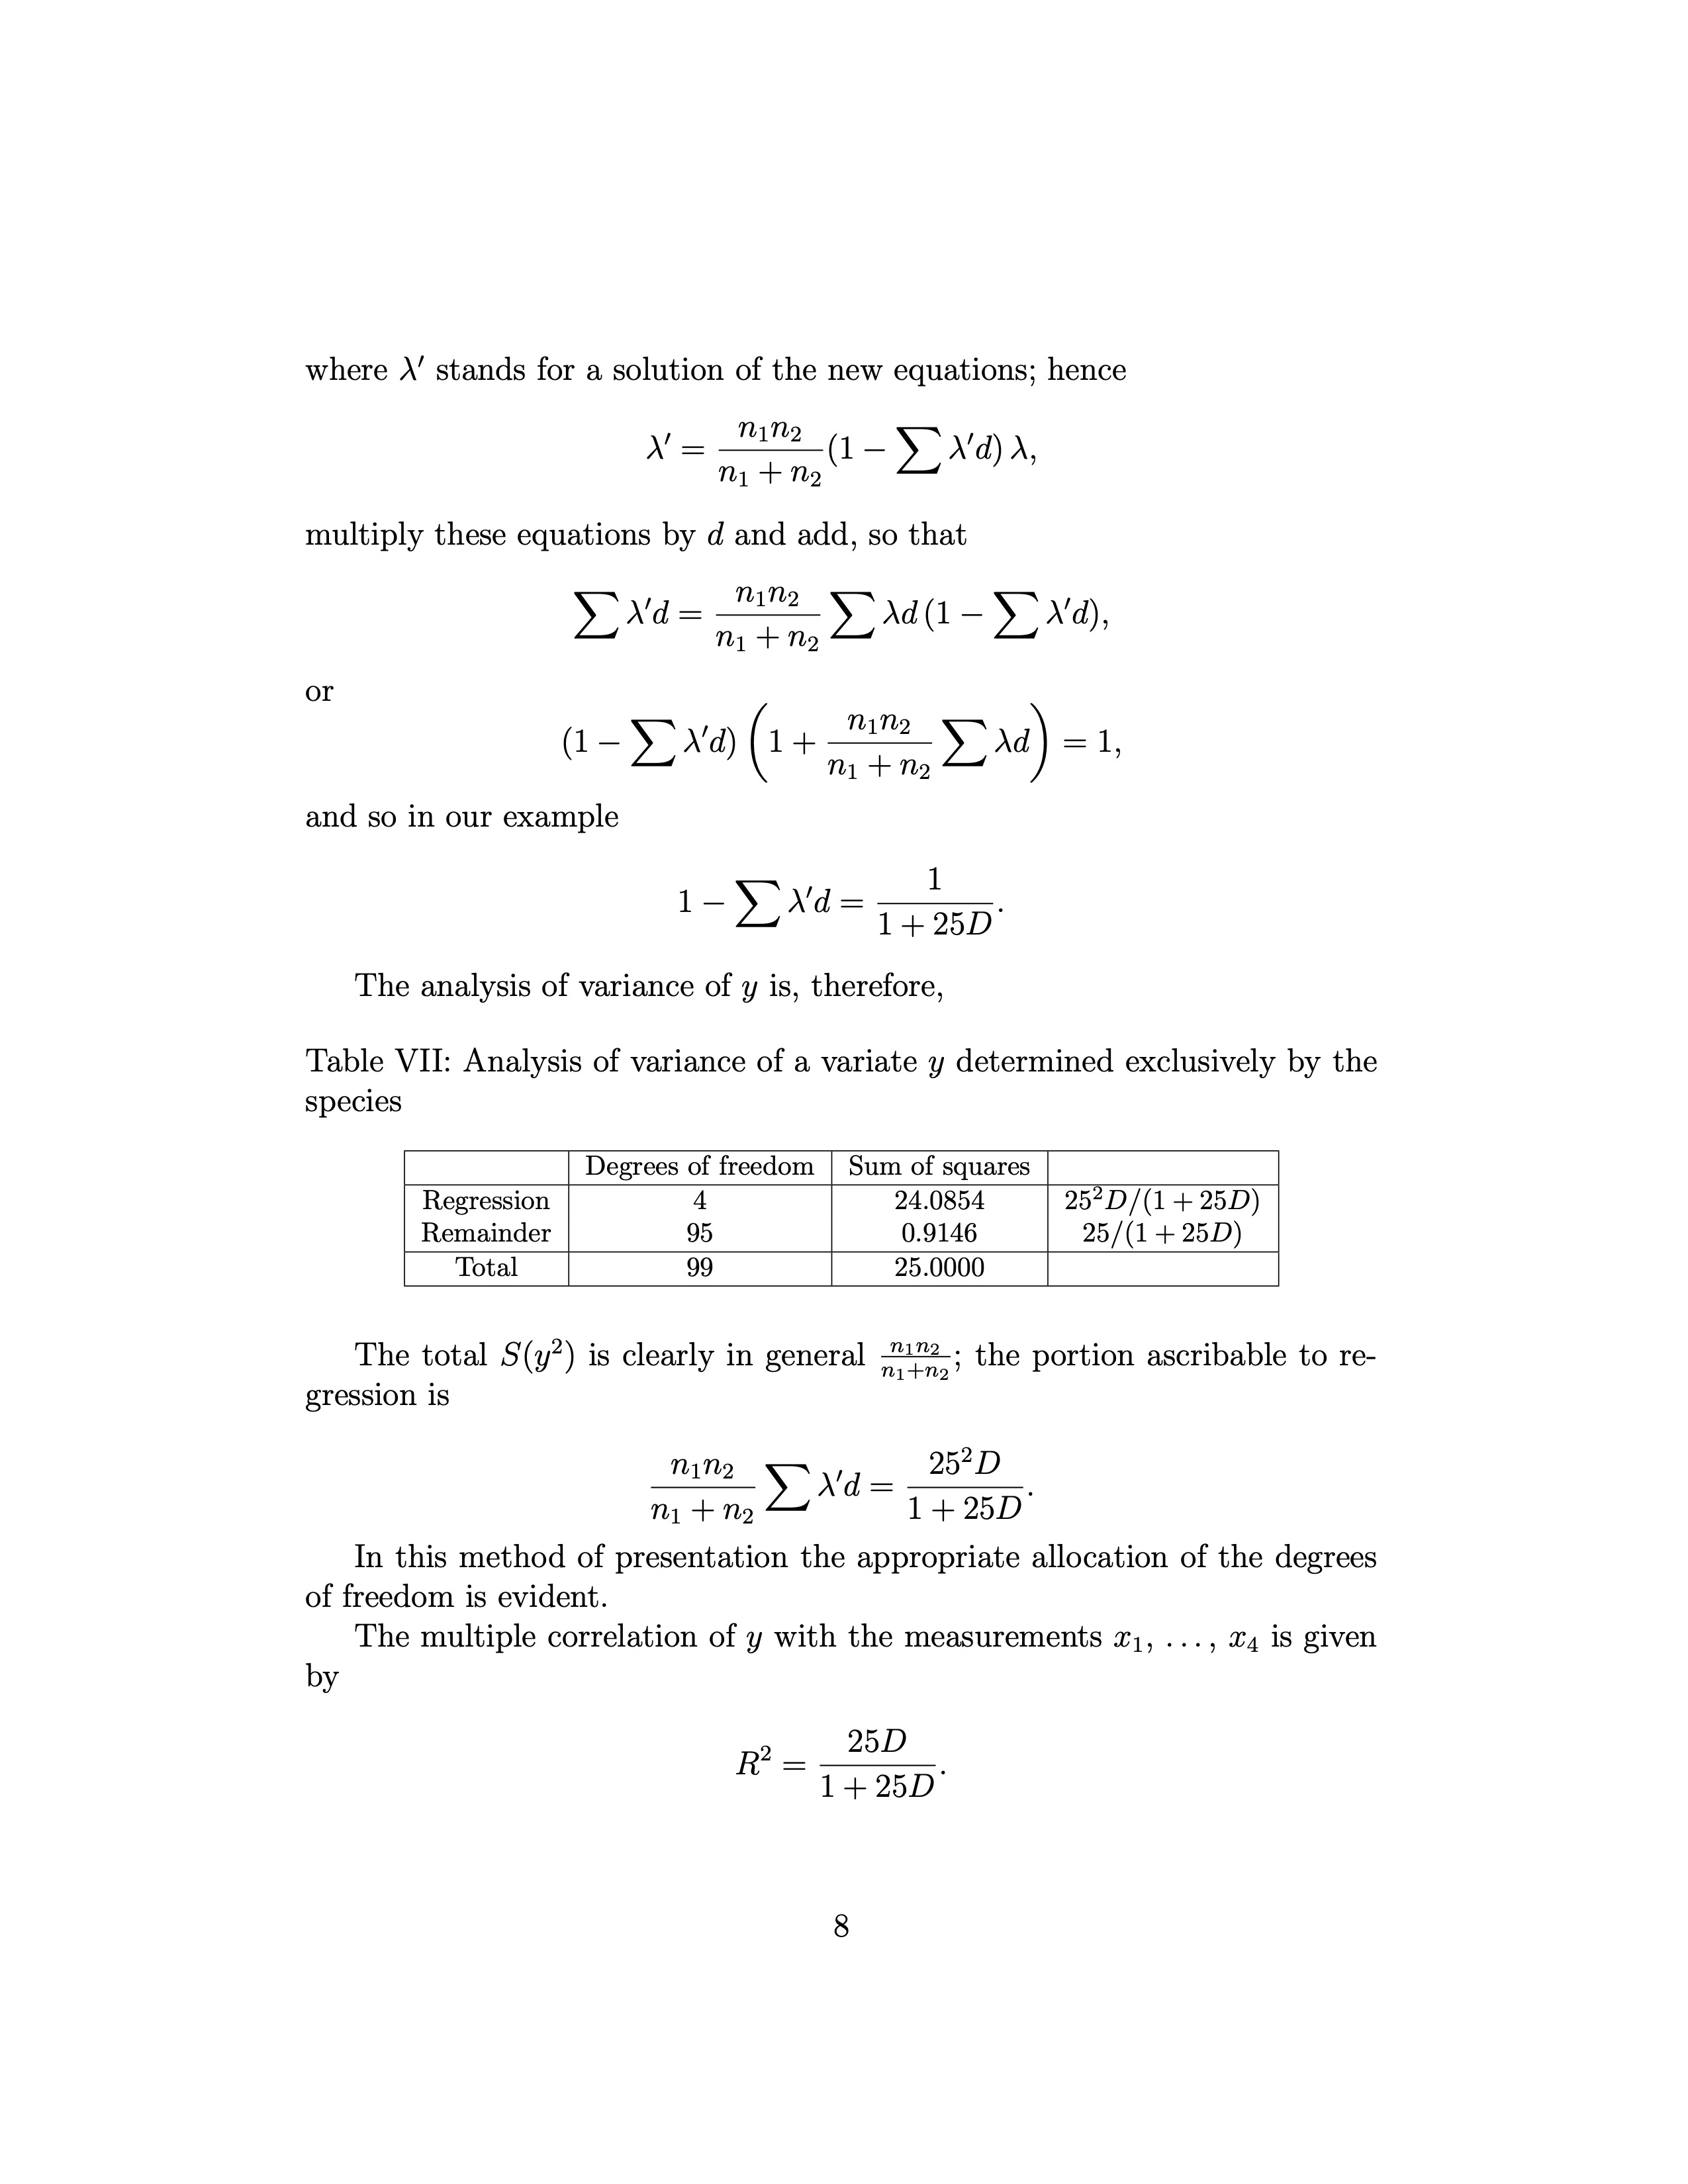
Page 8. English LaTeX version of Fisher's paper.
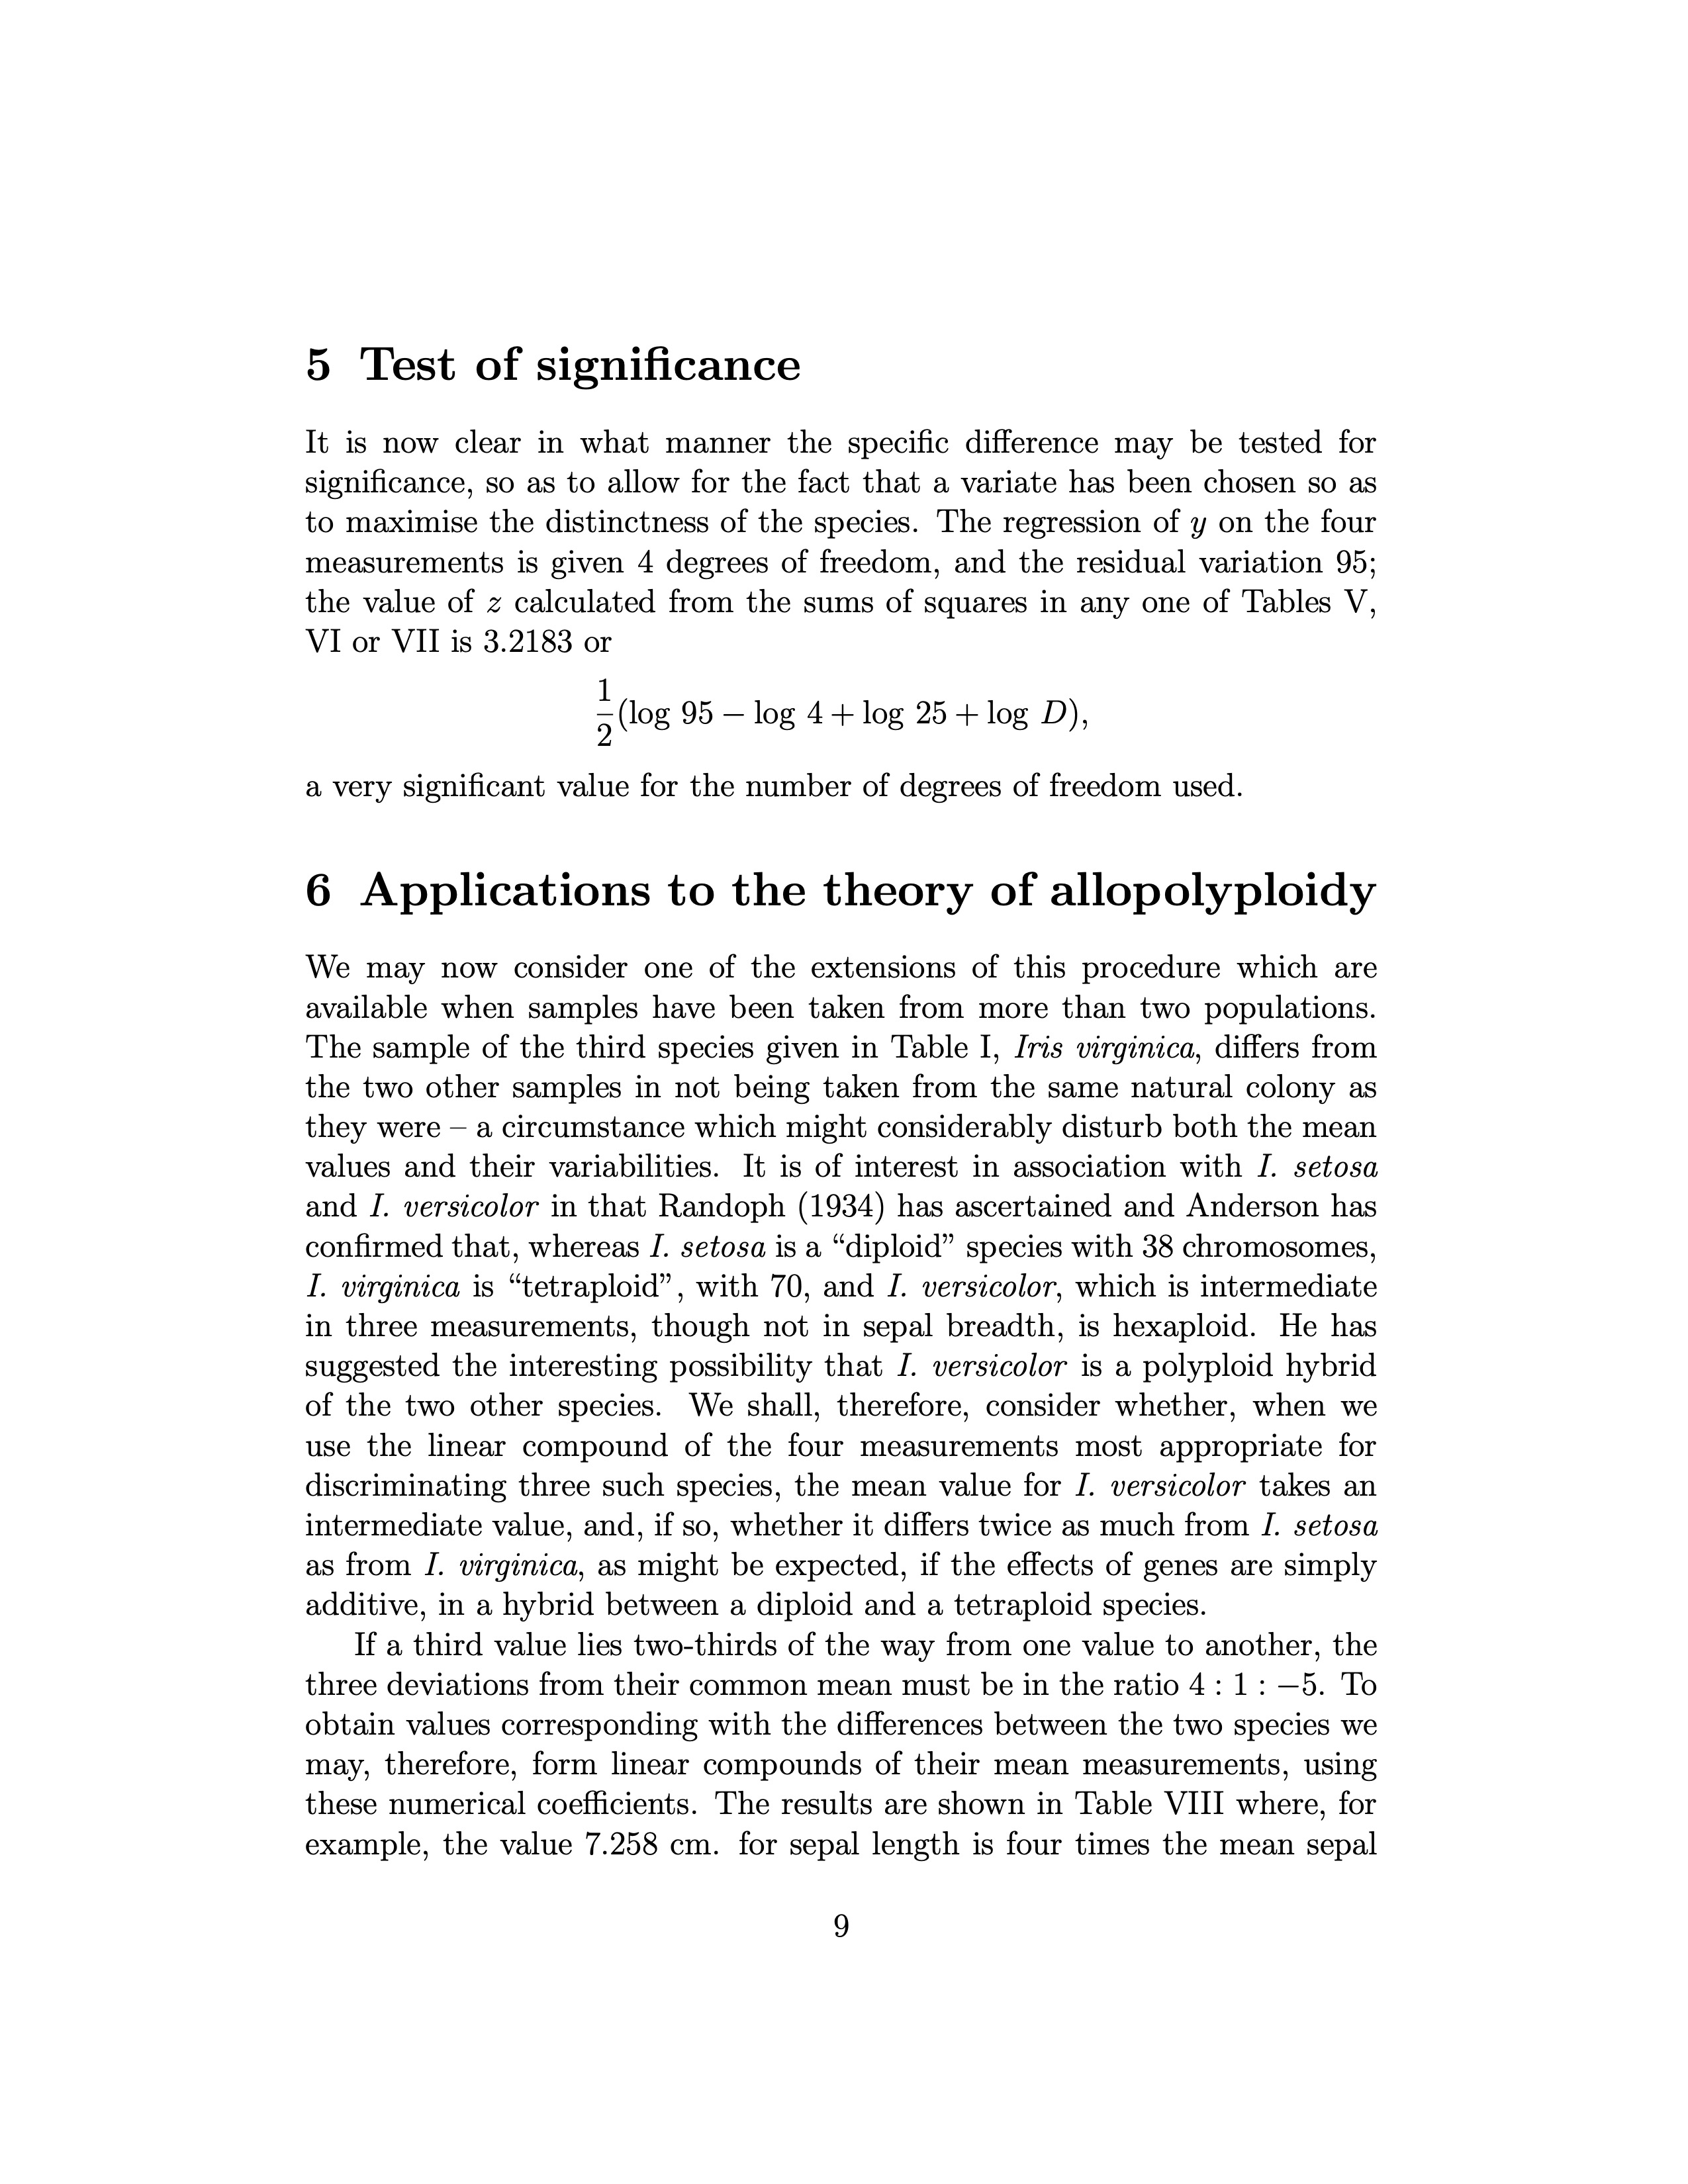
Page 9. English LaTeX version of Fisher's paper.
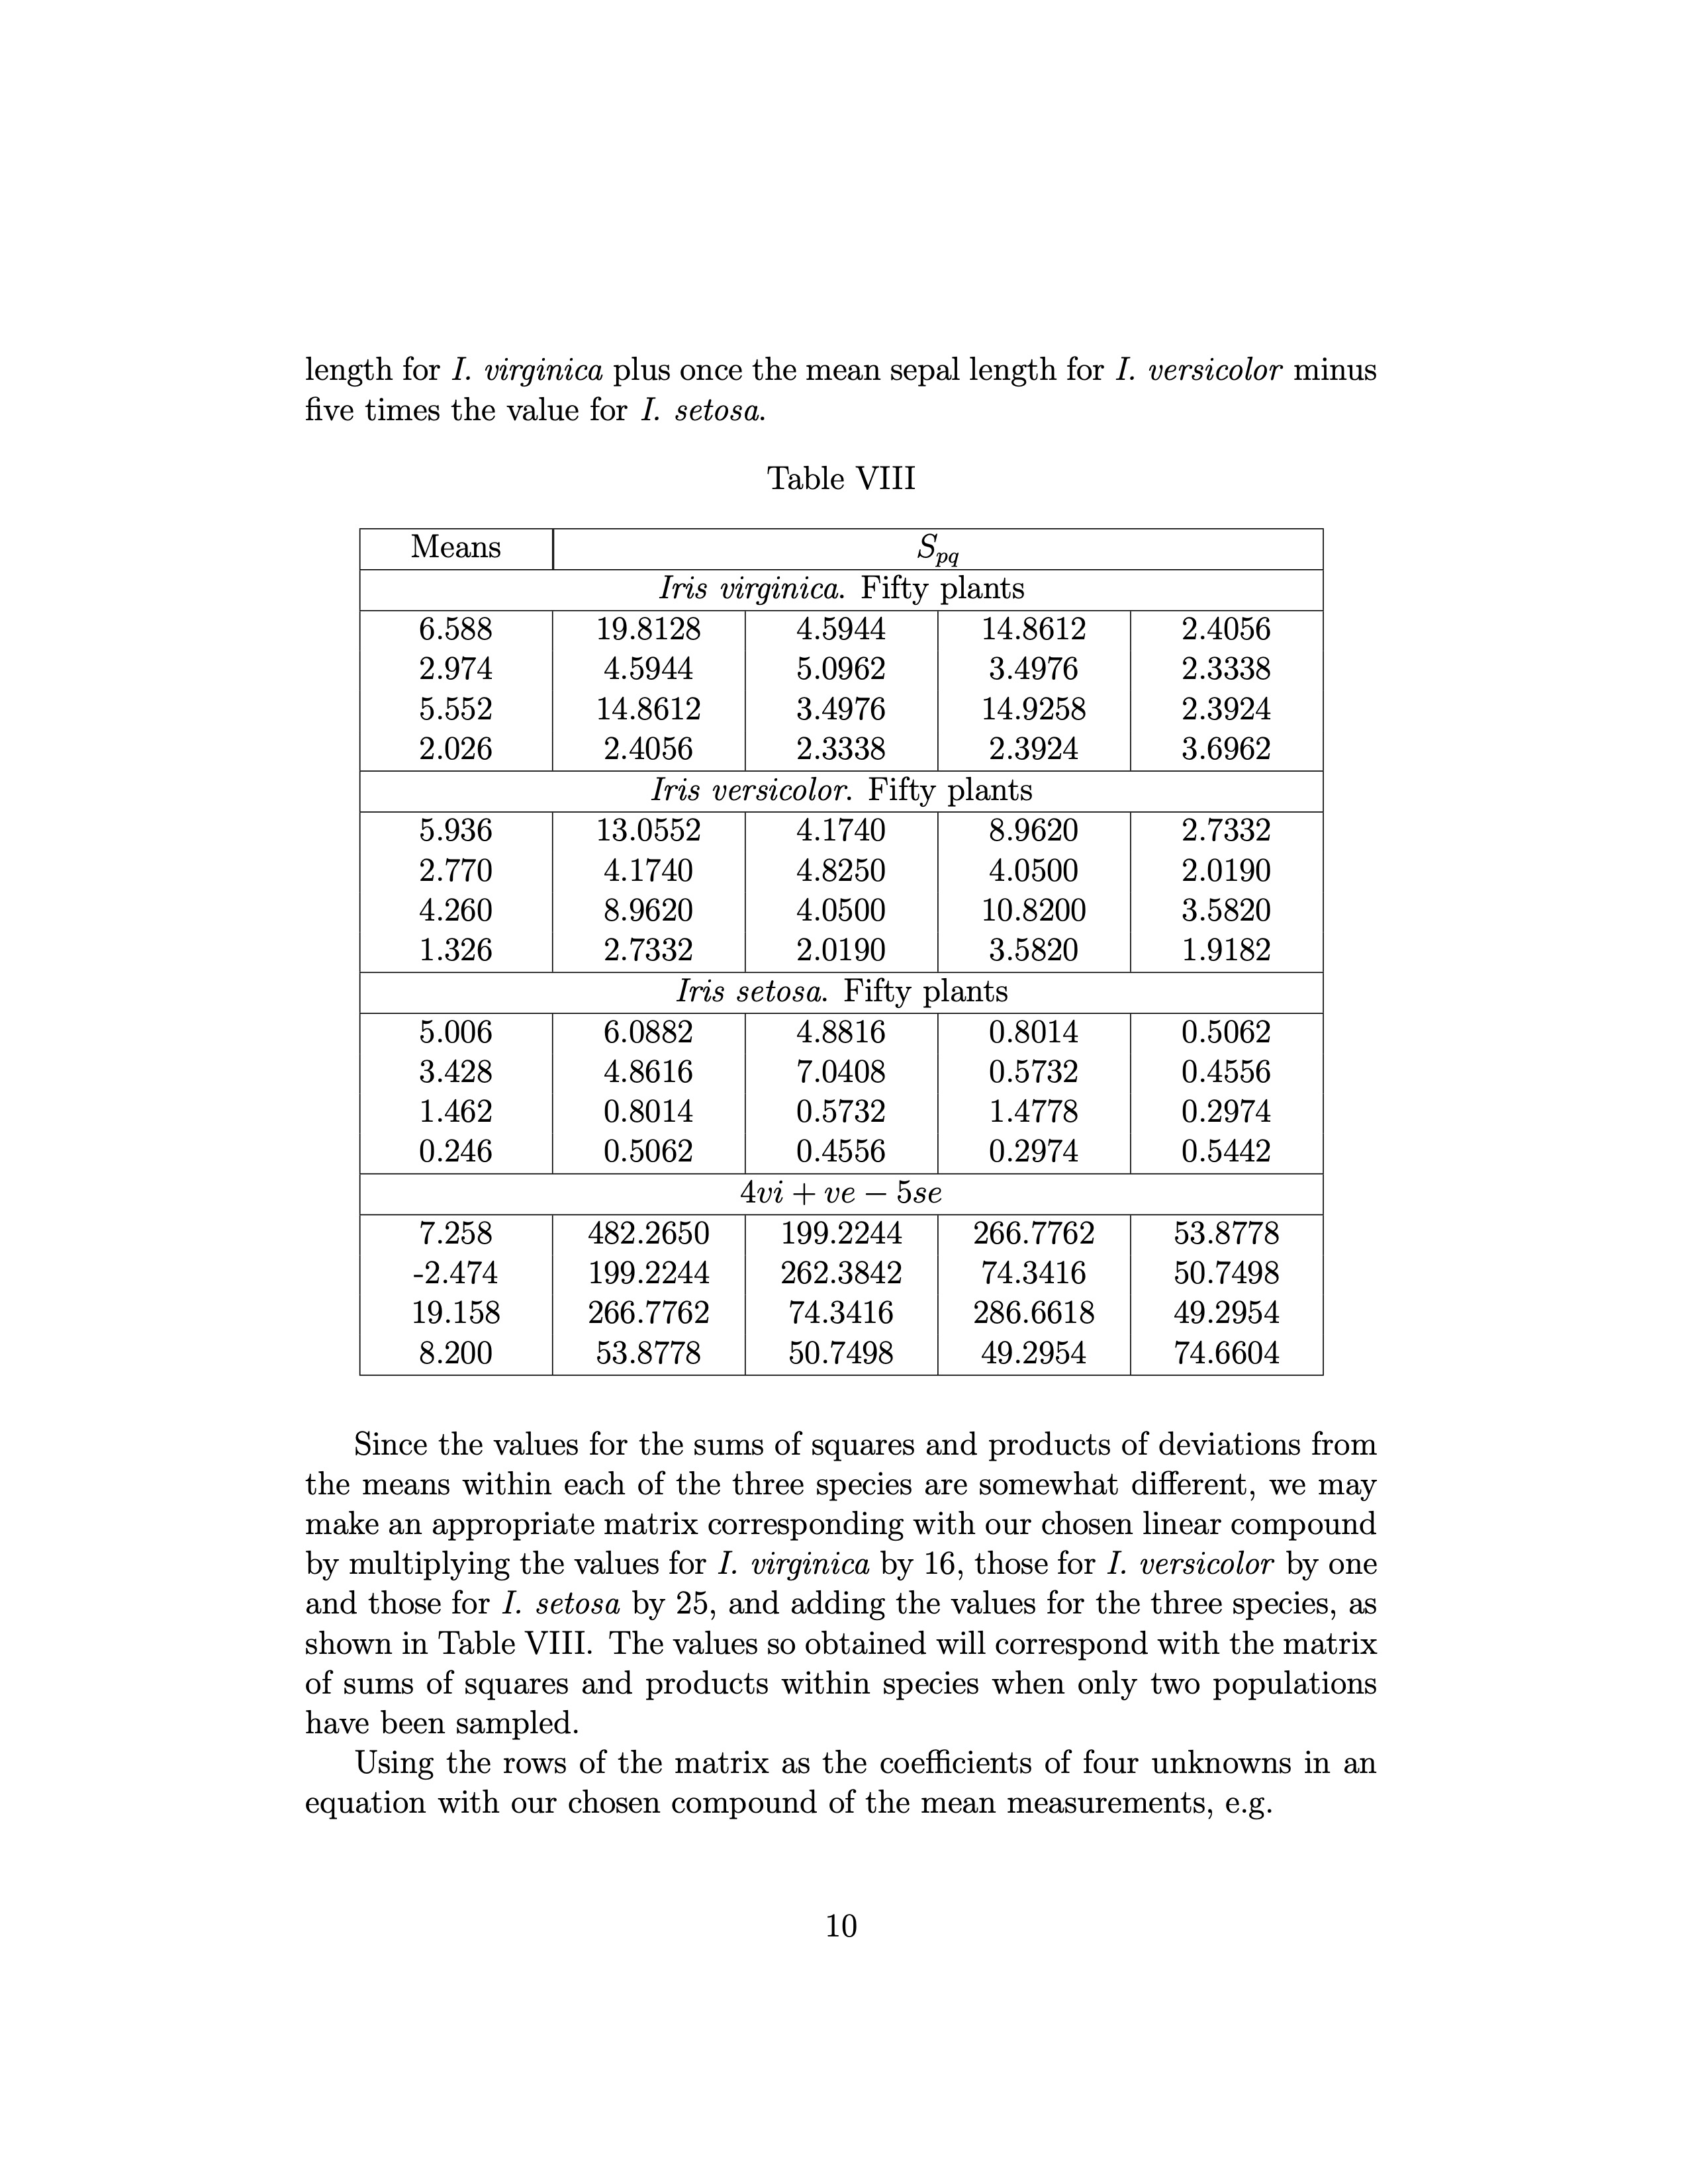
Page 10. English LaTeX version of Fisher's paper.
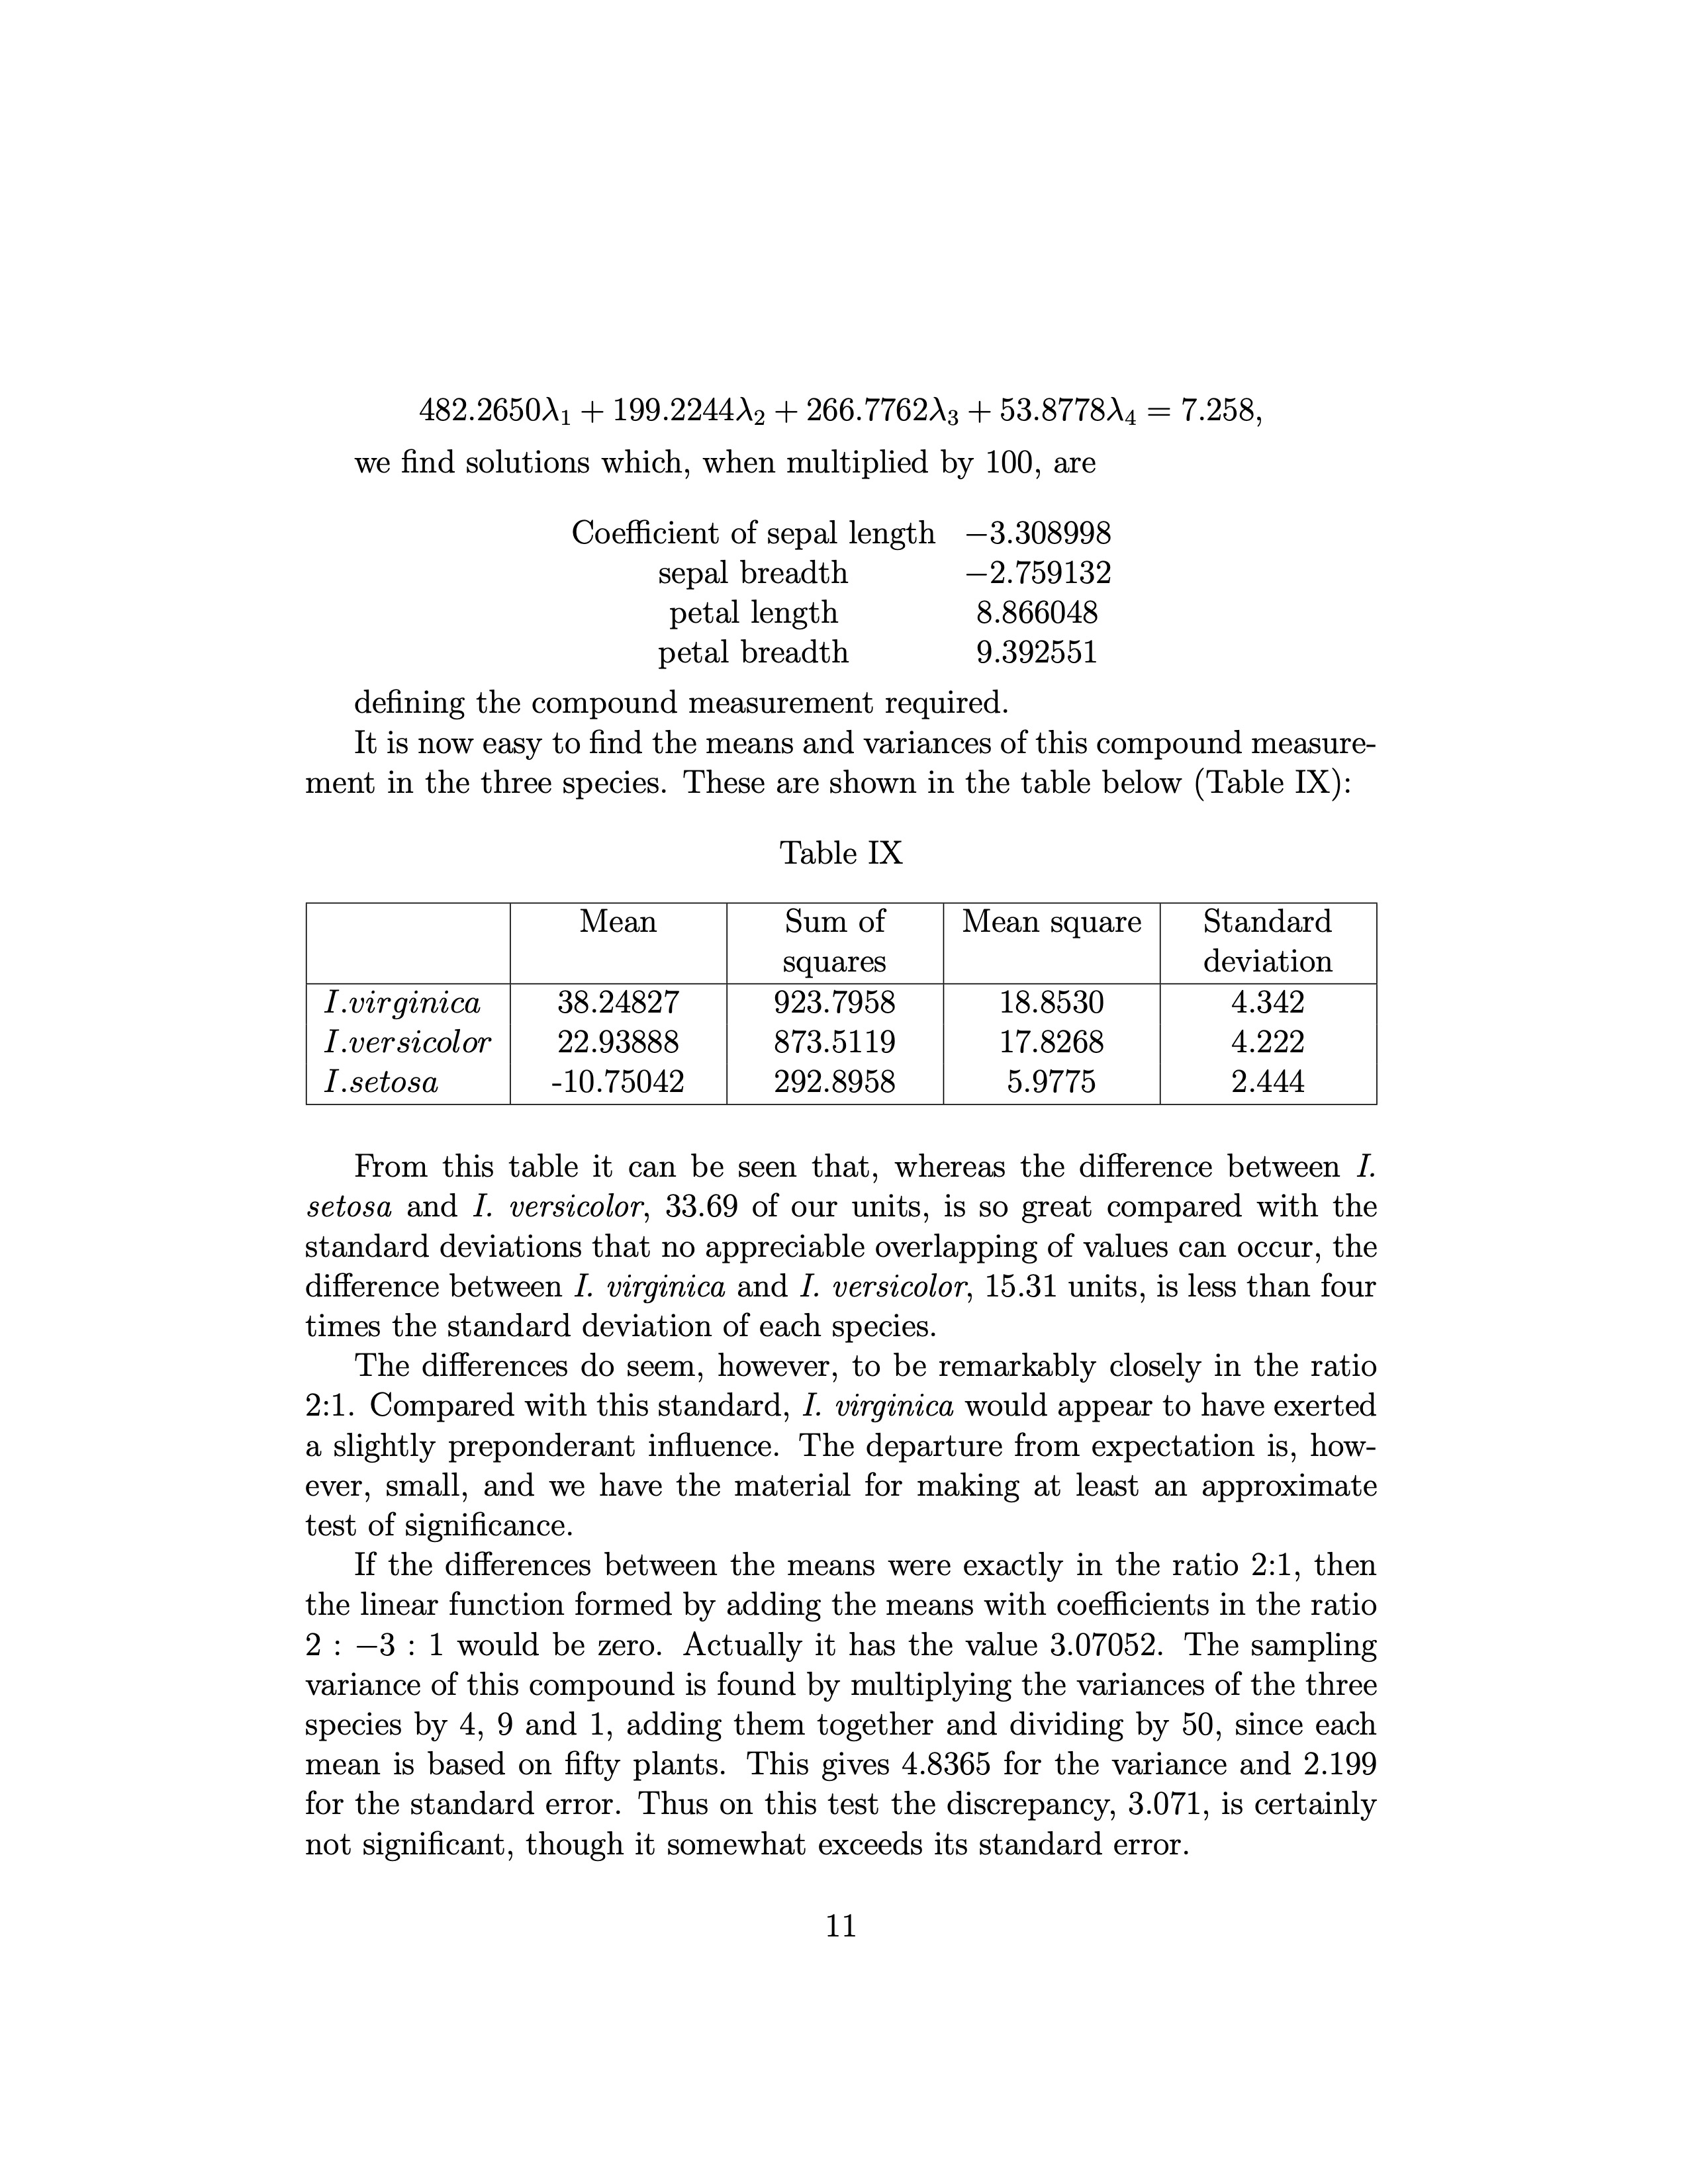
Page 11. English LaTeX version of Fisher's paper.
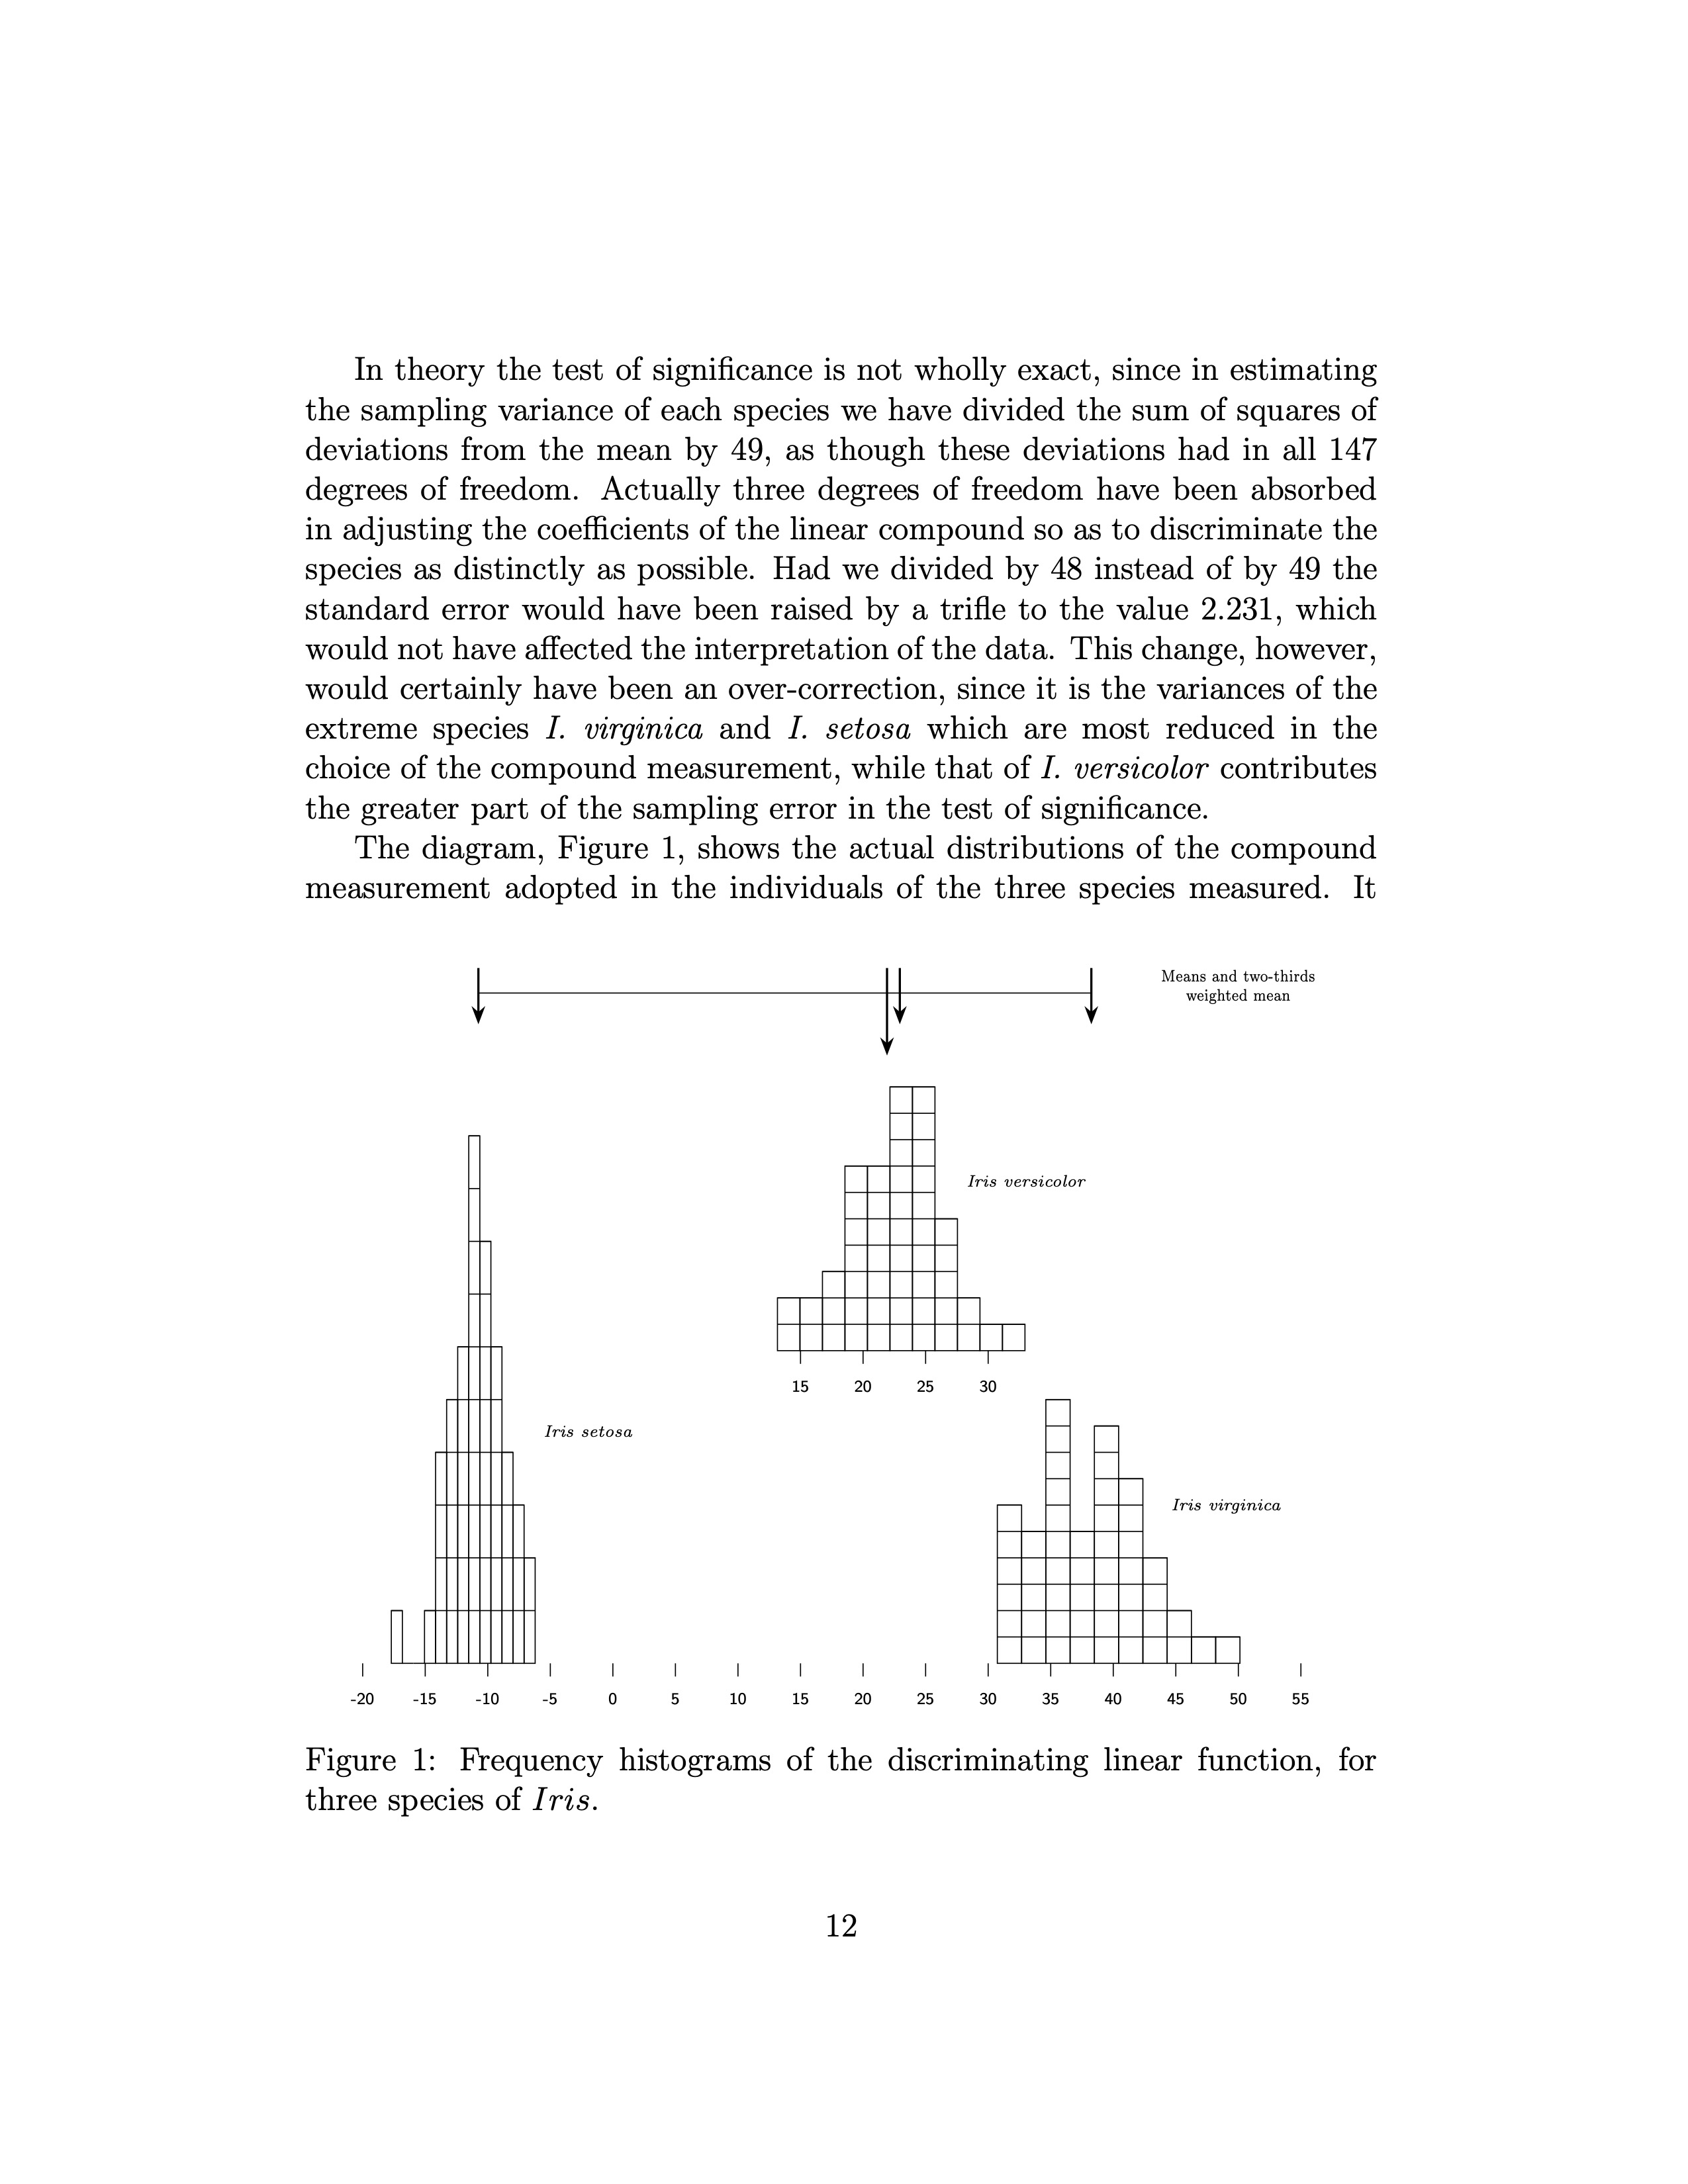
Page 12. English LaTeX version of Fisher's paper.
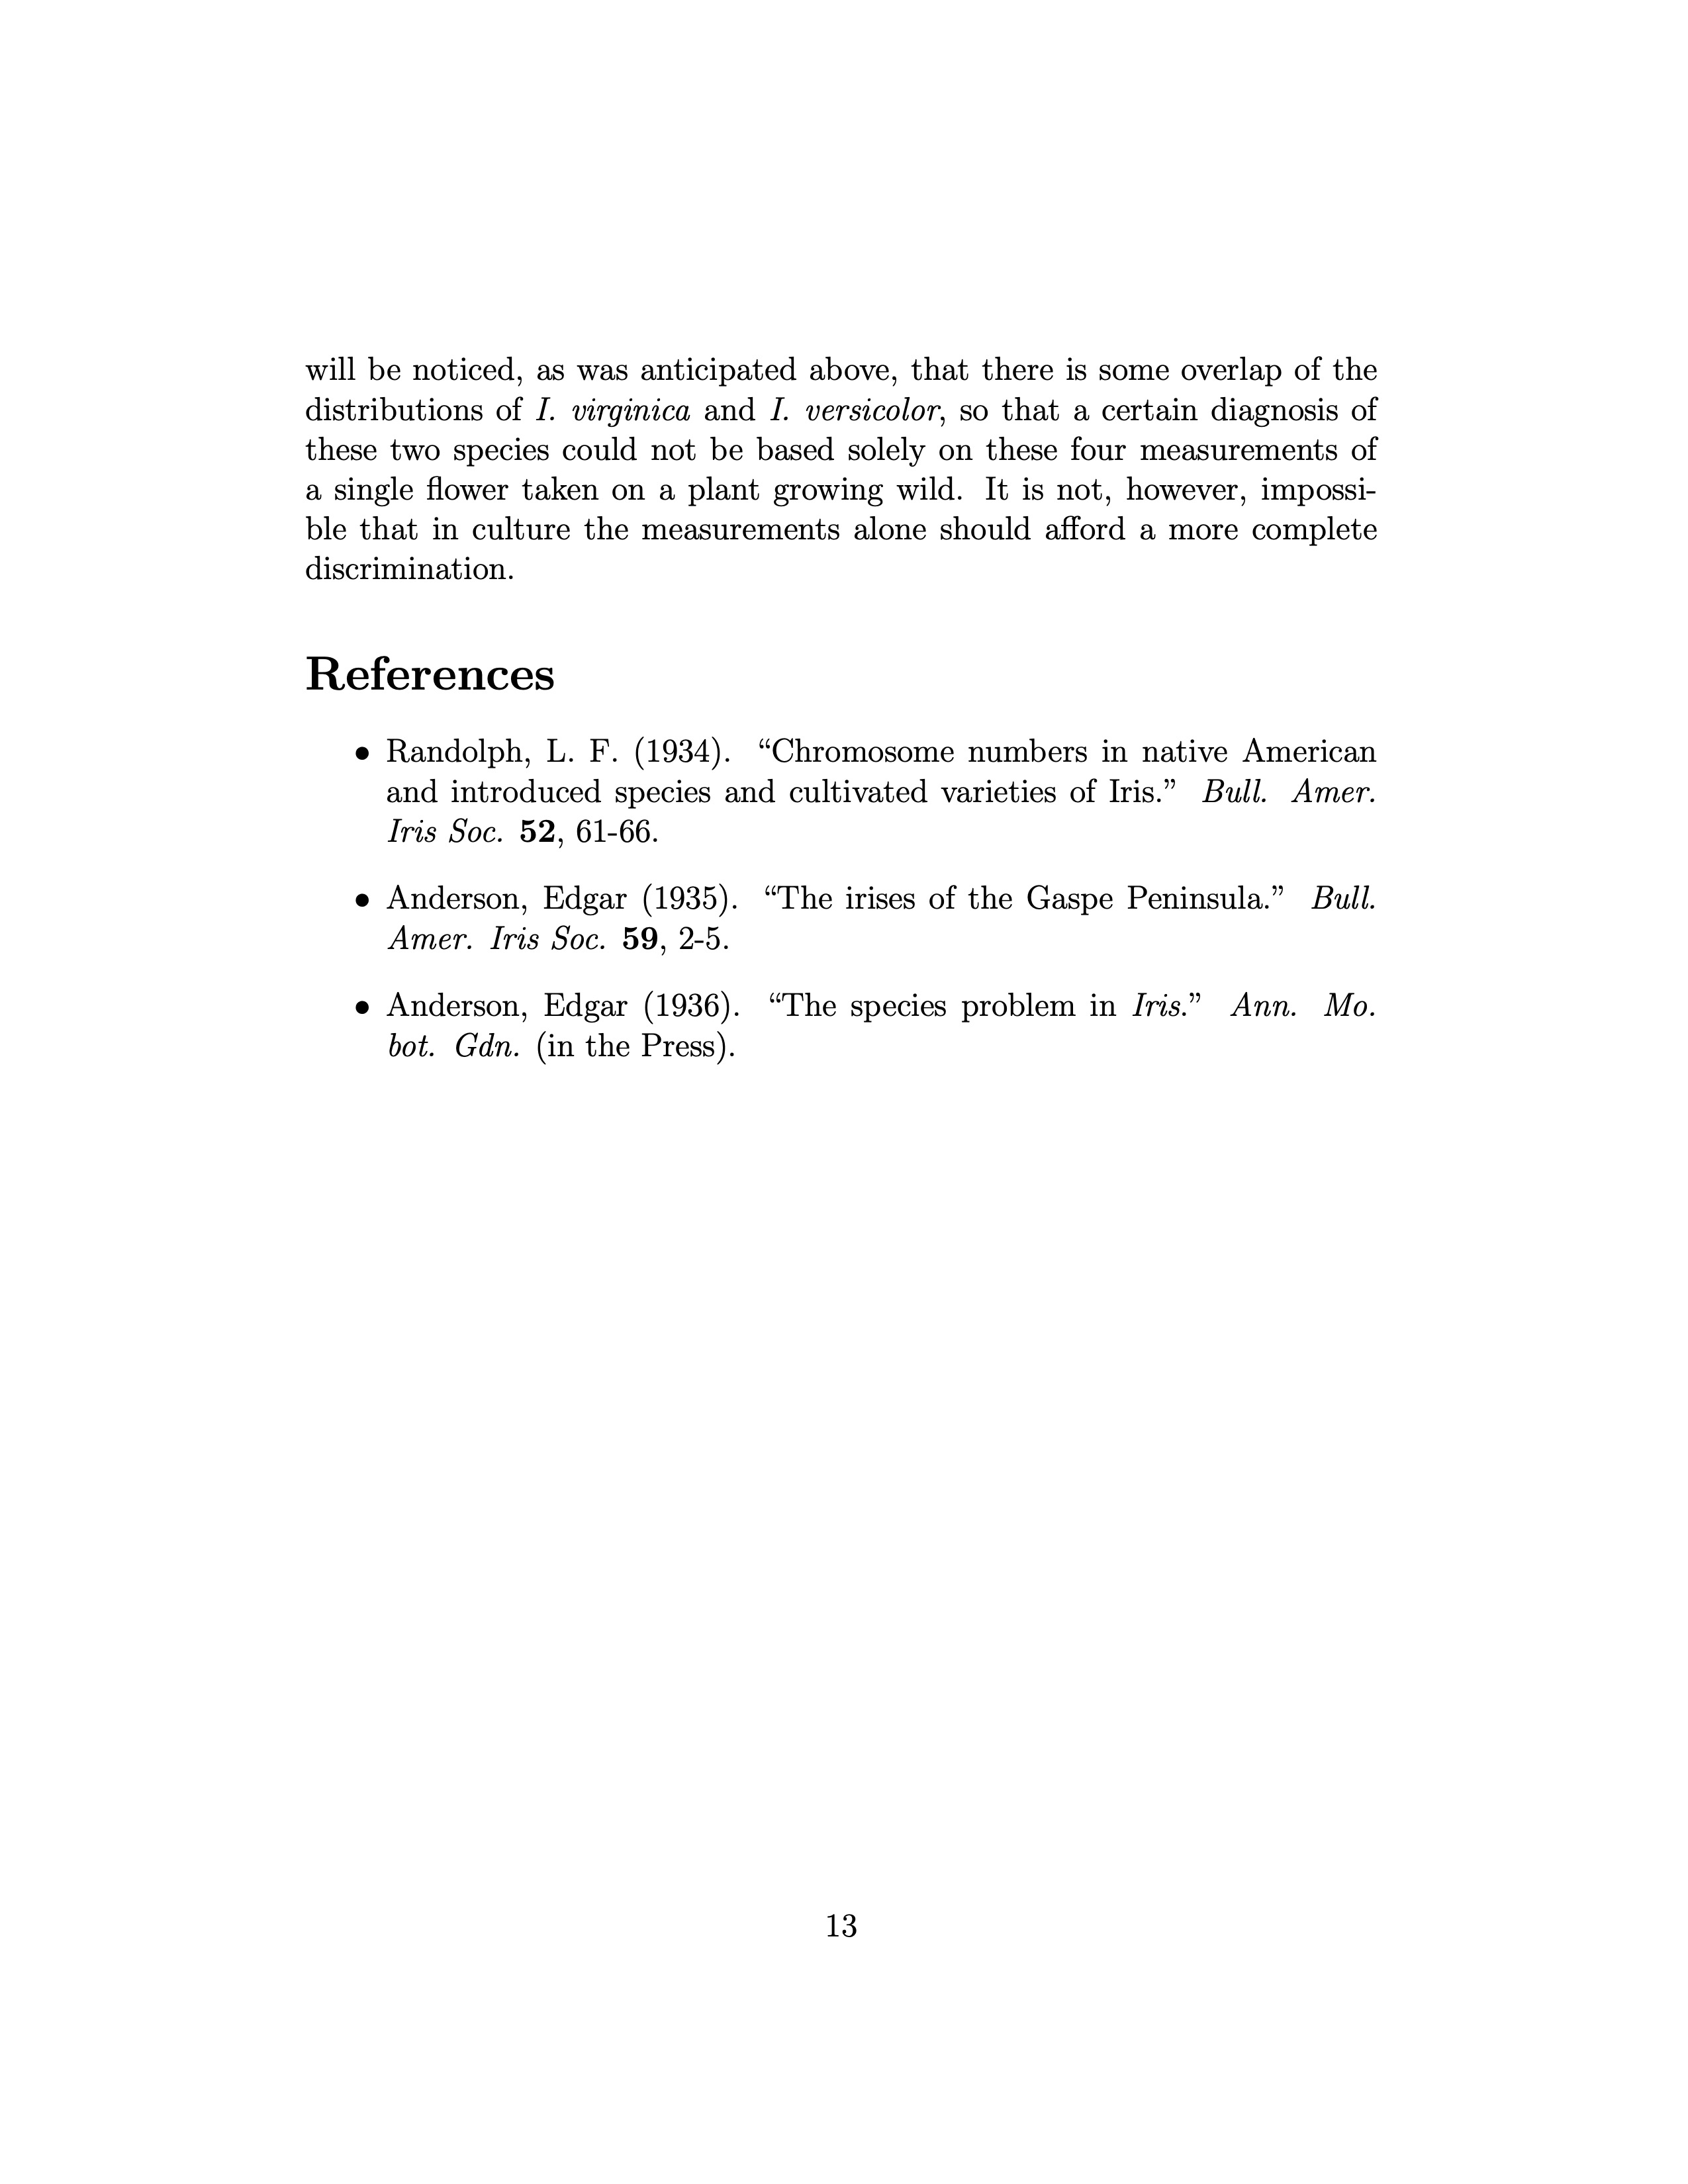
Page 13. English LaTeX version of Fisher's paper.
Who This Format Fits
- Authors of scientific and educational materials with formulas, tables, and charts.
- Teachers and editors who need a clean PDF and editable source files.
- Teams adapting technical materials across languages.
- Projects where documents must be reproducible: source files, build process, final PDF.
If you need a similar document, the starting point is the source material, a target formatting example, and a short description of the expected result. The output is a PDF and TeX source files that can be maintained further.