I keep this post here as a case study in practical data automation: not just a one-off scraper, but a working process that runs reliably on its own and produces a useful result.
The challenge had two parts. First: build a parser and deploy it so it runs every day for a full year. The solution ran on cron: every day it started, parsed the data, and appended records to a CSV archive. Second: make the data easy to read. Google Charts worked well for that; below are static screenshots from interactive chart versions (when all interactive charts are loaded on one page at once, the browser starts to struggle).
If you need something similar parsed (scheduled runs, archive accumulation, and clear data visualization), send your task via the brief.
Original Task
A year earlier, a climber friend wrote: “Here are the page URLs we need to monitor; they all have the same structure:
- http://www.mountain-forecast.com/peaks/Monte-San-Valentin/forecasts/4058
- http://www.mountain-forecast.com/peaks/Monte-Burney/forecasts/1758
- http://www.mountain-forecast.com/peaks/Lautaro/forecasts/3380
- http://www.mountain-forecast.com/peaks/Monte-Darwin/forecasts/2488
- http://www.mountain-forecast.com/peaks/San-Lorenzo-Patagonia/forecasts/3706
- http://www.mountain-forecast.com/peaks/Cerro-Arenales/forecasts/3437
Without a quick way on Mac to circle things in red on a screenshot, I described in text what should be parsed:
Weather Forecast Issued (local time) - probably better to split this into three fields: Time, Day, Month-Year, so it is easier to calculate averages later in Excel.
And for the nearest day, three times (am/pm/night columns), collect:
- Summary (text)
- Wind (km/h)
- Snow (cm)
- High °C
- Low °C
- Chill °C
- Freezing level (m)
It should be enough to visit once a day at 9:00 St. Petersburg time, which is 3 a.m. in their local time - there will definitely be three columns for the nearest day. Store everything, probably, in CSV.”
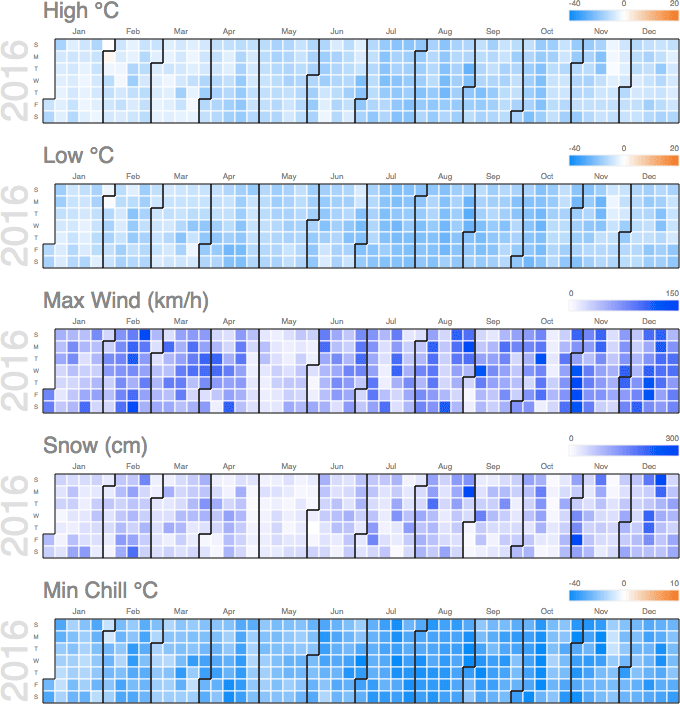
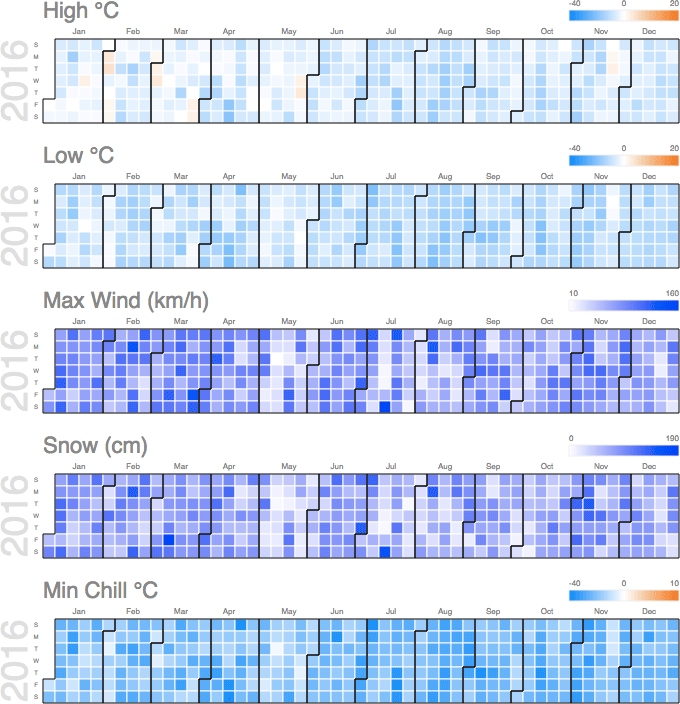
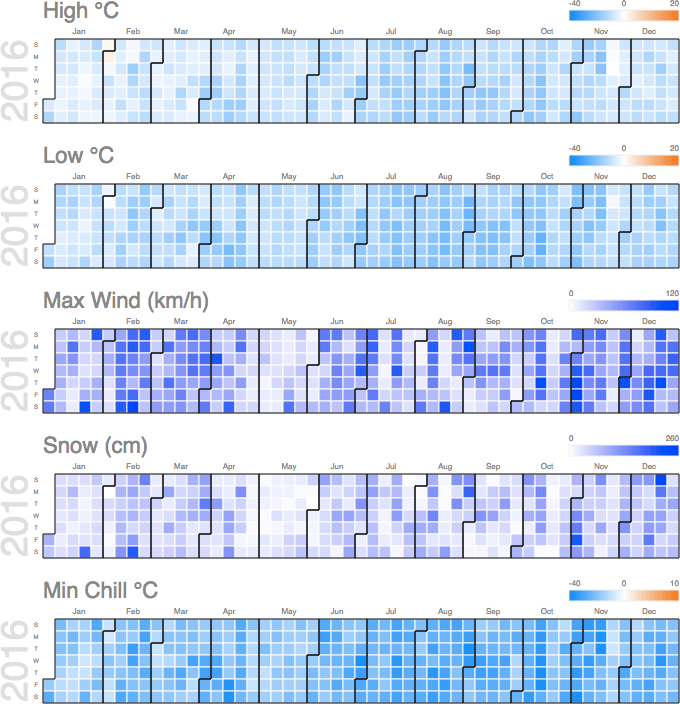
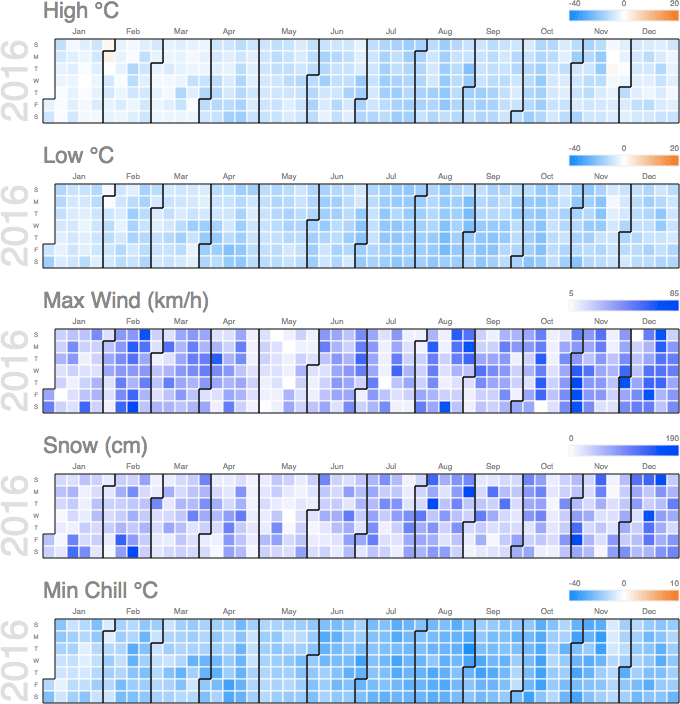
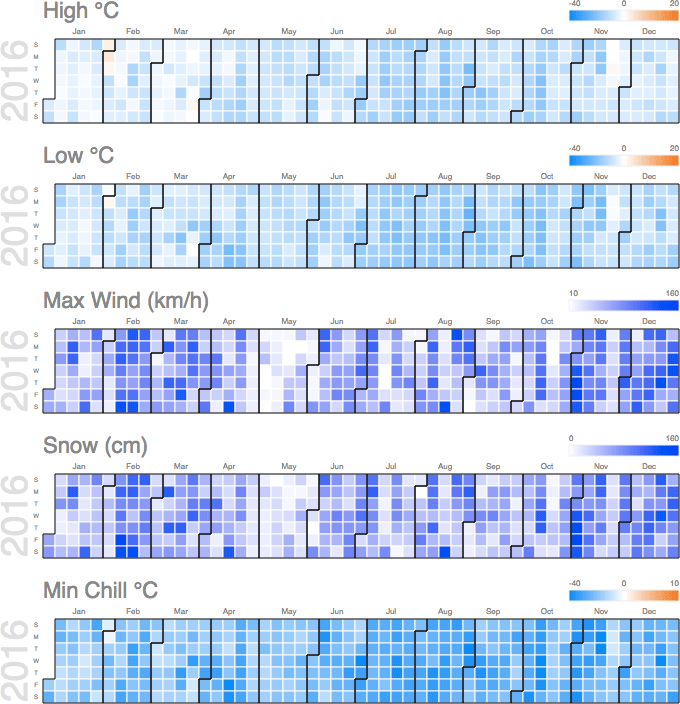
For temperature, the average is not very useful. We need two separate charts: daily maximum and daily minimum.
+ maximum wind speed
+ wind chill
List of mountains in Chile (Wikipedia)
Here is what came out of it.
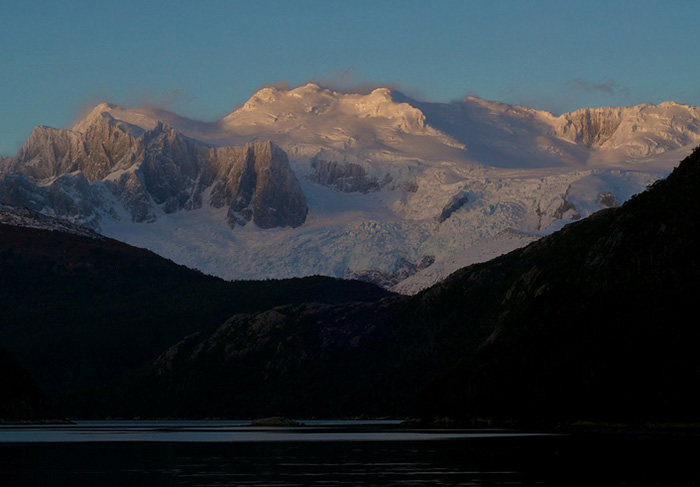
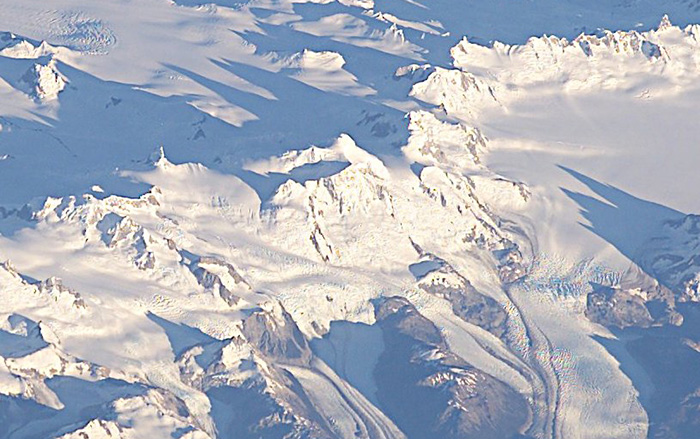
Monte Burney
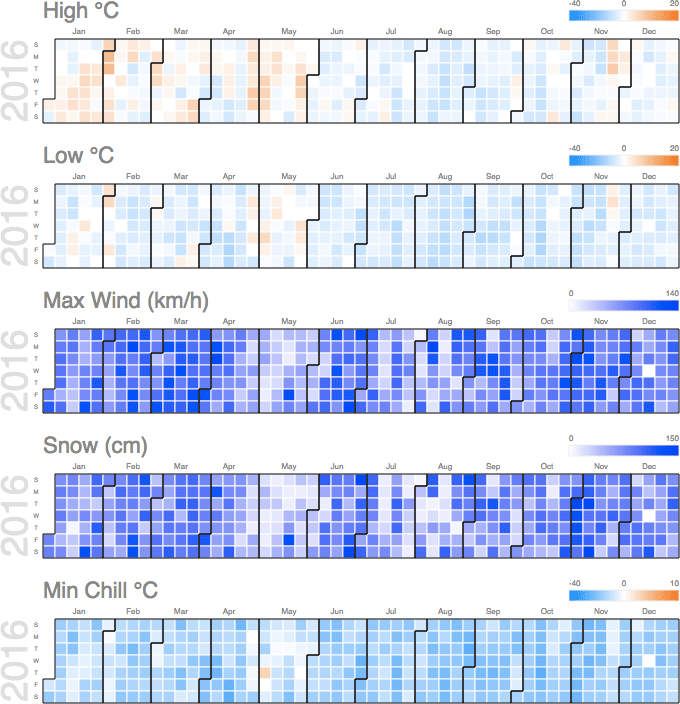
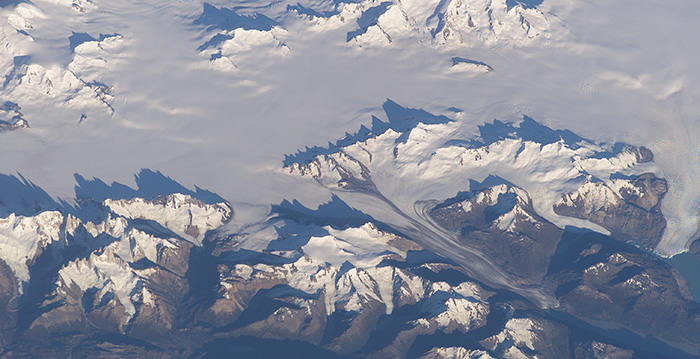
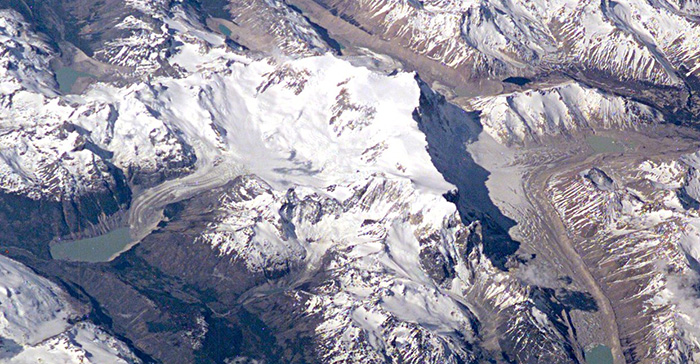
Monte Darwin
Lautaro
Cerro Arenales
San Lorenzo Patagonia
Monte San Valentin