Traffic accidents on the Untolovo map: an interactive map of crashes with injuries
May 26, 2026 · Services: Maps · Data · Static sites
“Traffic accidents on the Untolovo map” is a small public data-first project about road safety in the Untolovo municipal district. Instead of scattered crash records and dry statistics, the user gets a map of accident concentration points with injuries, summary tables, and context: where pedestrian and cyclist collisions happen, when crashes are more frequent, and how the situation changes by year.
Open the “Traffic accidents in Untolovo” project: https://untolovo-dtp.github.io/
For projects like this, visualization is only one part of the work. First, you need to understand the data source, the limitations of the statistics, the territorial boundaries, and the user flow: residents, municipal representatives, activists, and journalists need a verifiable argument for discussions about street safety, not an abstract map.
The project is deployed on free infrastructure and has been running since 2020 with zero hosting cost. The map and statistics pages can be opened without a separate backend, while the data remains available as a clear public display.
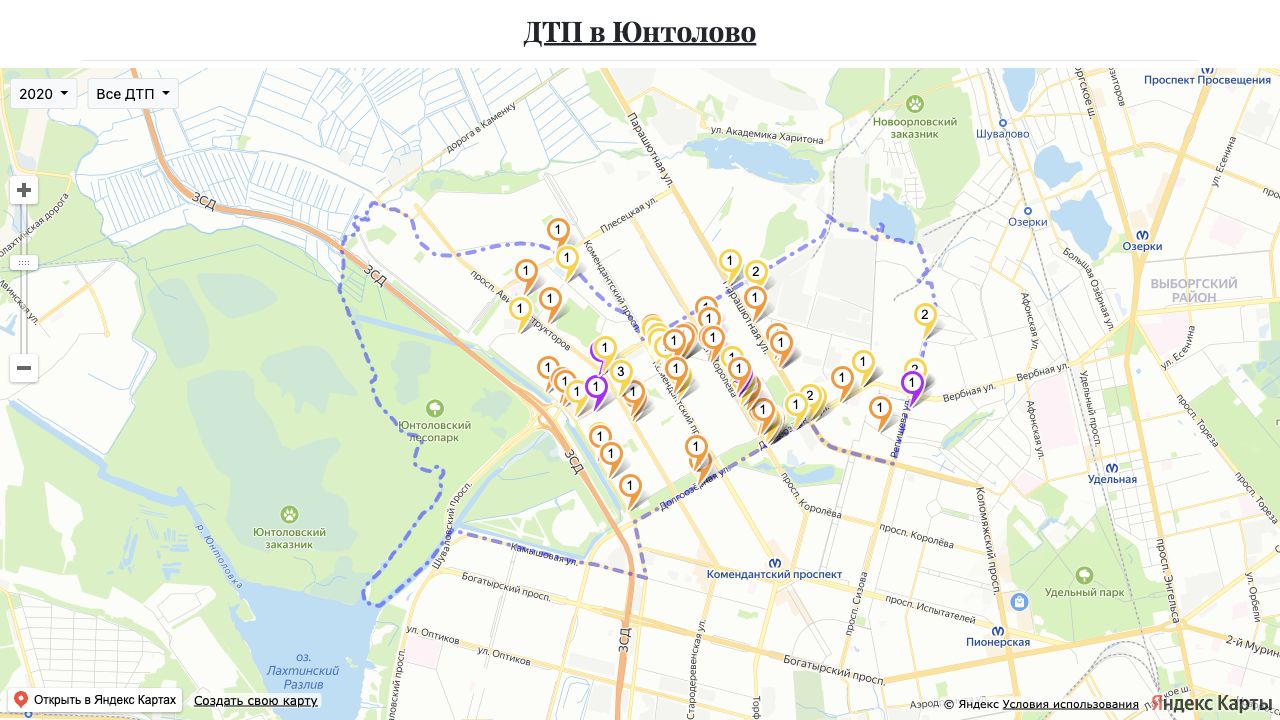
Figure 1. Traffic accident map of Untolovo: users can see the municipal boundary, crash points, and switch between year and accident type.
Task
The goal was to show road crashes not as generic city noise, but as a local issue on a specific territory. The project needed to:
- collect data on traffic accidents with injuries and fatalities for 2016-2020;
- separate crashes relevant to Untolovo residents from accidents on boundary highways;
- show accident concentration points on a map;
- highlight especially sensitive groups: pedestrians, cyclists, passengers, and children;
- provide public statistics that can be used in discussions, appeals, and materials about the urban environment.
Data Source and Structure
The project used 2016-2020 data from the Russian traffic police road safety statistics website. Only accidents with fatalities or injuries were included; crashes without injuries are not represented in that statistics source.
The dataset limitations were recorded separately: some crashes formally assigned to the area on the Western High-Speed Diameter and Kamyshovaya Street were not included in the main focus because they describe everyday risks for residents of the municipal district less accurately. At the same time, accidents at boundary intersections were counted when they related to street nodes important for Untolovo.
What the Data Showed
- The public display includes 384 accidents for 2016-2020.
- 46 accidents involving children are marked separately.
- The period includes 13 fatalities and 448 injured people.
- 152 incidents are pedestrian collisions, 42 are cyclist collisions, and 19 are passenger falls.
- Accidents involving pedestrians and cyclists were placed into a separate group because these participants are more often connected with the local territory and the quality of the urban environment.
Technical Outline
- Frontend: static website.
- Map: interactive map with switching by year and accident type.
- Data: accident records, aggregates by year, accident type, time of day, and month.
- Sources: open traffic police statistics and public municipal materials.
- Publishing: GitHub Pages, without a separate server application.
- Discussion: public Telegram channel for feedback on the issue.
For a small civic tech project, this setup works well from a maintenance-cost perspective: the data can be prepared in advance, pages load quickly, and the result is easy to share as a link in correspondence, an appeal, or a publication.
User Flow
A user can start with the map to see specific crash locations, or with the statistics to assess the scale of the issue. From there, they can move to years, accident types, and related materials: the data source, regulatory documents, and the municipal budget for preventing road traffic injuries.
This turns the map from a decorative widget into an entry point for research: where the dangerous points are, which participant groups are affected more often, when accidents happen, and what questions should be asked of responsible services.
Result
- A public traffic accident map of Untolovo was launched, with binding to years and accident types.
- Raw records and tables became a display understandable to people who do not work with source exports.
- The project showed local risks for pedestrians, cyclists, passengers, and children.
- The statistics became suitable for public oversight: they can be used in discussions of the urban environment and road safety.
- The case study shows the applied mechanics of a data-first approach: data source, cleaning, sample limitations, map, statistics, and a clear user flow.
Who This Format Fits
- Municipal and city projects that need to show a problem on a map.
- Public initiatives that need verifiable data for argumentation.
- Editorial and research teams that want to turn tables into an interactive publication.
- Businesses and nonprofit projects where geography, categories, and filters matter more than a complex backend.
If you need a similar result: I help collect data, bring it into a stable structure, build the map, prepare statistics pages, and package everything into a usable public display.
Public project: Traffic accidents in Untolovo.